¶ Summary
The Summary tab on the Analytics page provides a summarized view of the organization’s cybersecurity and compliance status. It consolidates key metrics from different frameworks, controls, and audits to help you quickly understand the current state of implementation and identify areas that require attention.
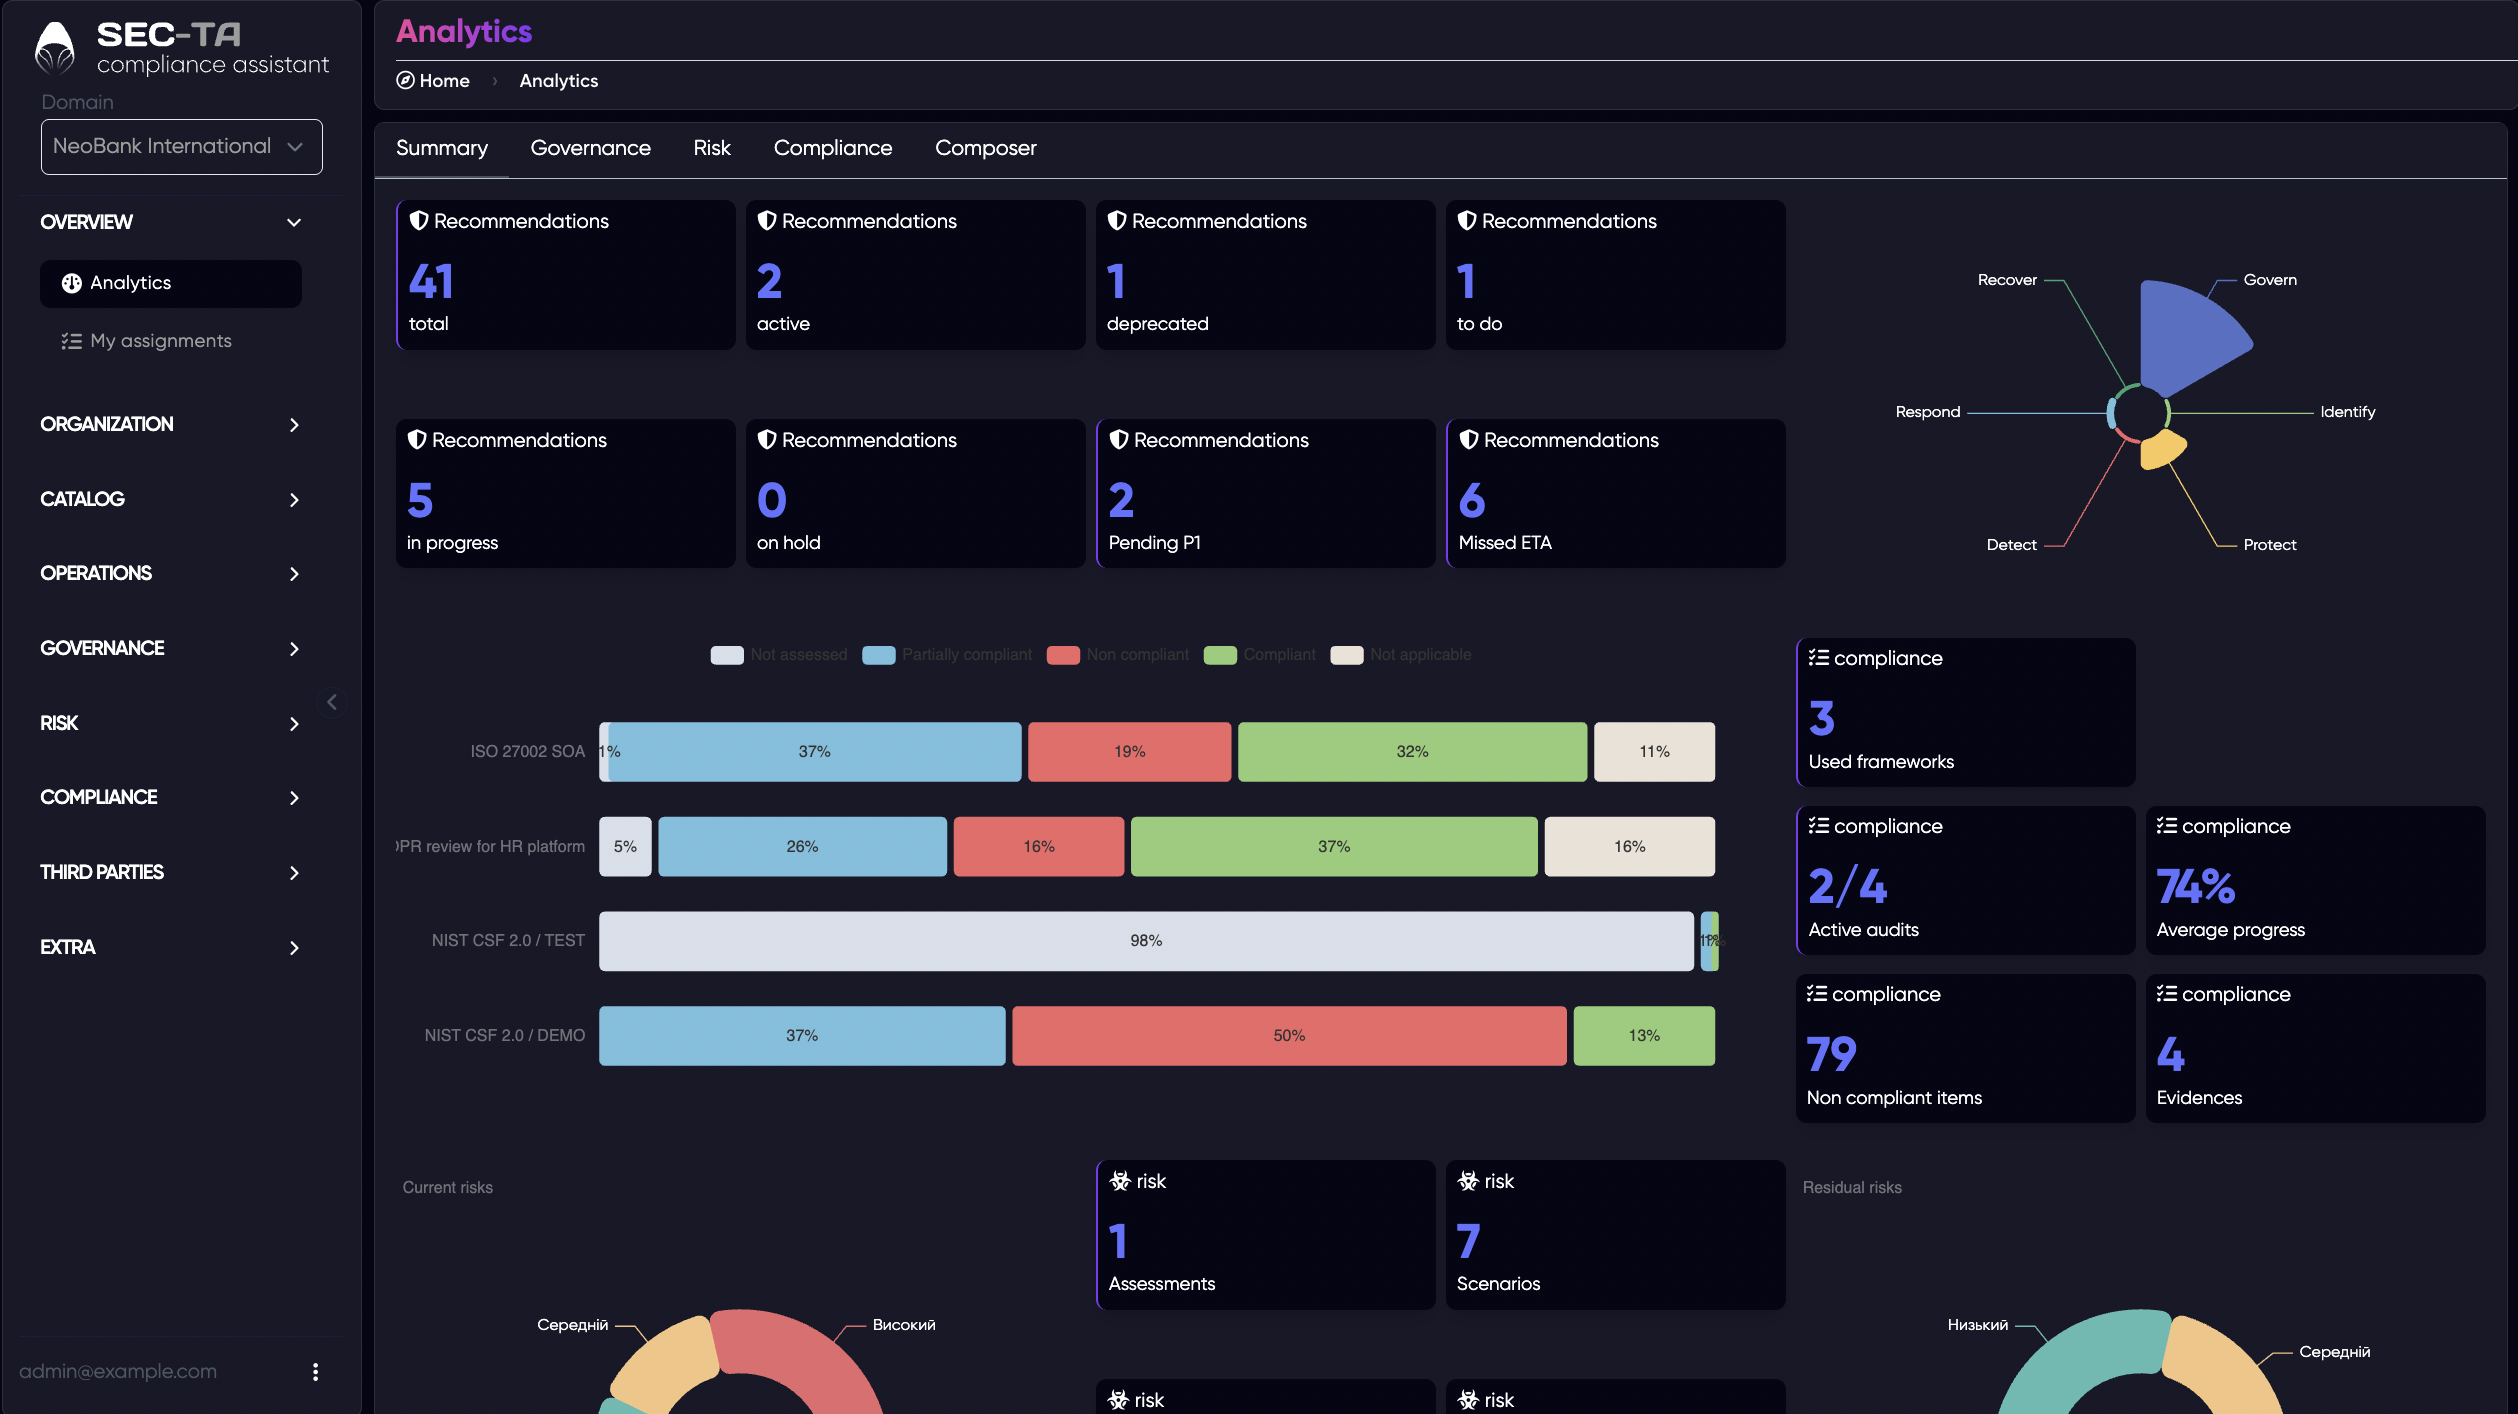
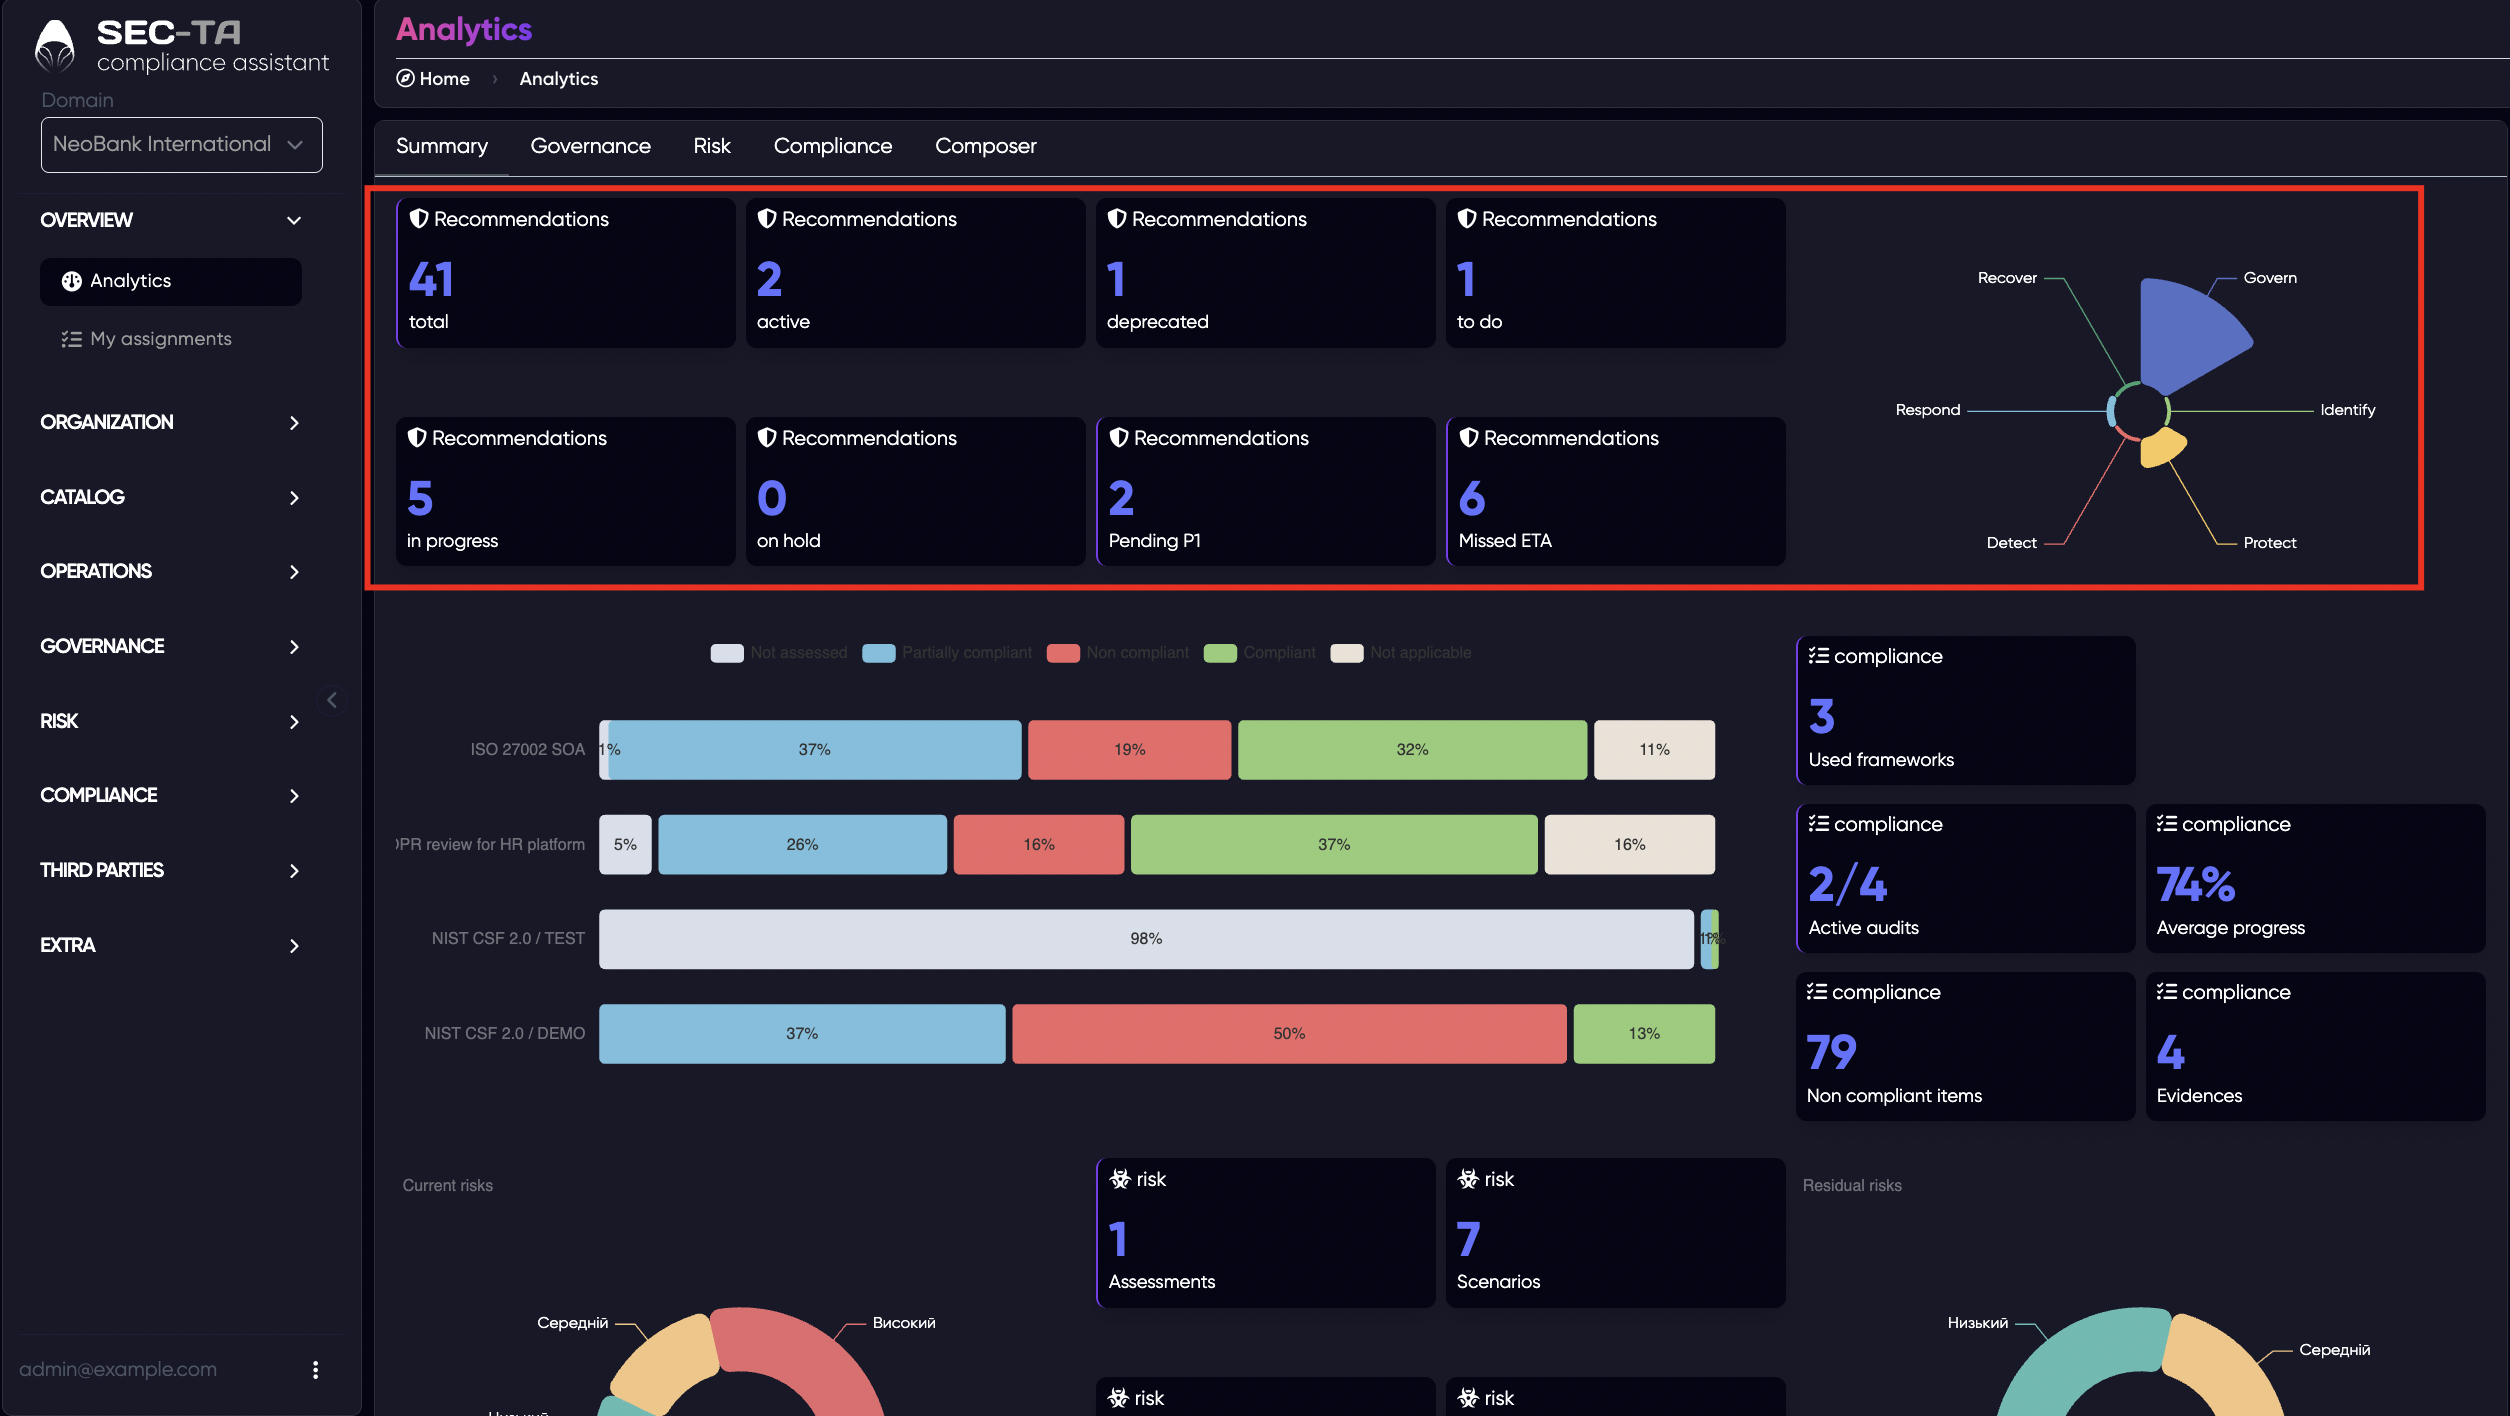
At the top of the page, you can see key statistics for security controls, including:
- Total controls - the total number of controls across all domains.
- Active controls - controls currently being implemented or monitored.
- Outdated / Pending controls - items that require review or are awaiting completion.
- In progress / Suspended / Missed ETA (deadline overdue) - statuses showing implementation progress and any delays.
- Priority P1 - controls marked as critical or high priority.
On the right side, a radar chart visualizes the distribution of implemented controls across the six NIST CSF 2.0 Functions — Govern, Identify, Protect, Detect, Respond, and Recover. This allows you to quickly see which areas are strong and which need more focus.
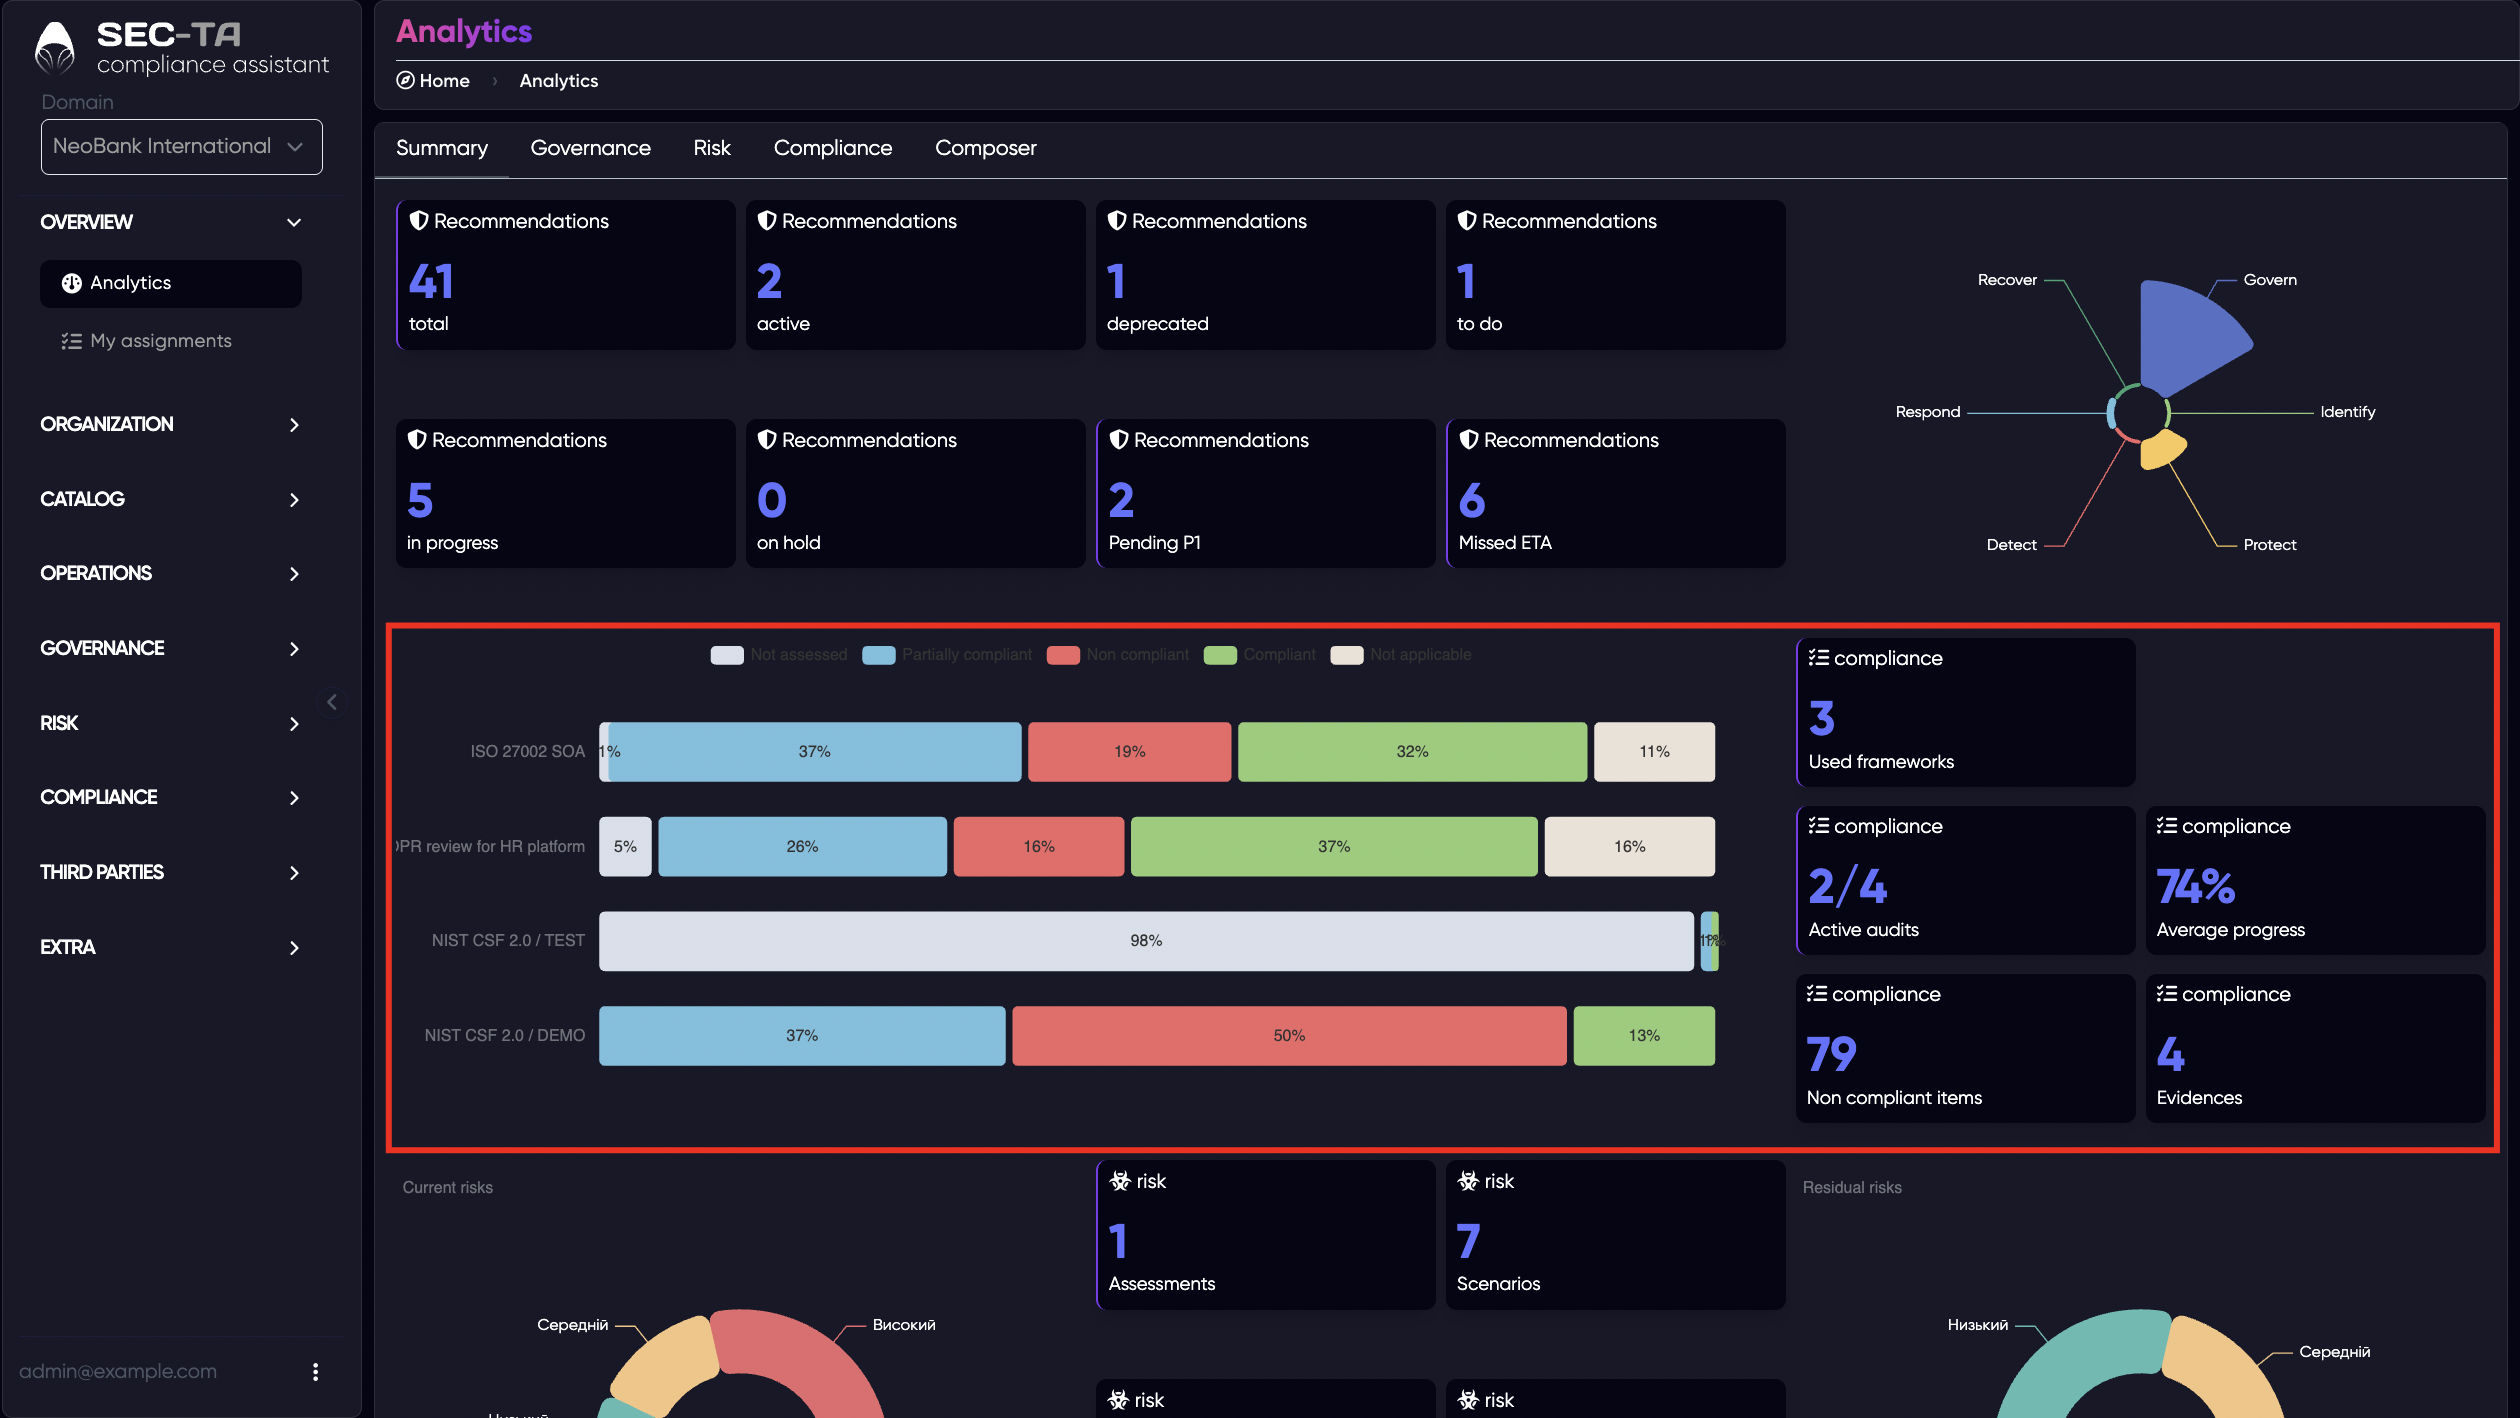
Below, a progress bar chart compares different frameworks or audits (such as ISO 27002, NIST CSF, GDPR reviews, etc.) showing the percentage of controls that meet requirements, partially meet requirements, do not meet requirements, are not applicable and have not been assessed.
On the right panel, several widgets summarize complementary information:
- Frameworks used - the number of compliance or security frameworks applied.
- Active audits - how many audits are currently running.
- Average progress - overall progress percentage across all audits or frameworks.
- Unverified objects - items or entities still awaiting verification.
- Evidence - total number of documents or proofs supporting compliance.
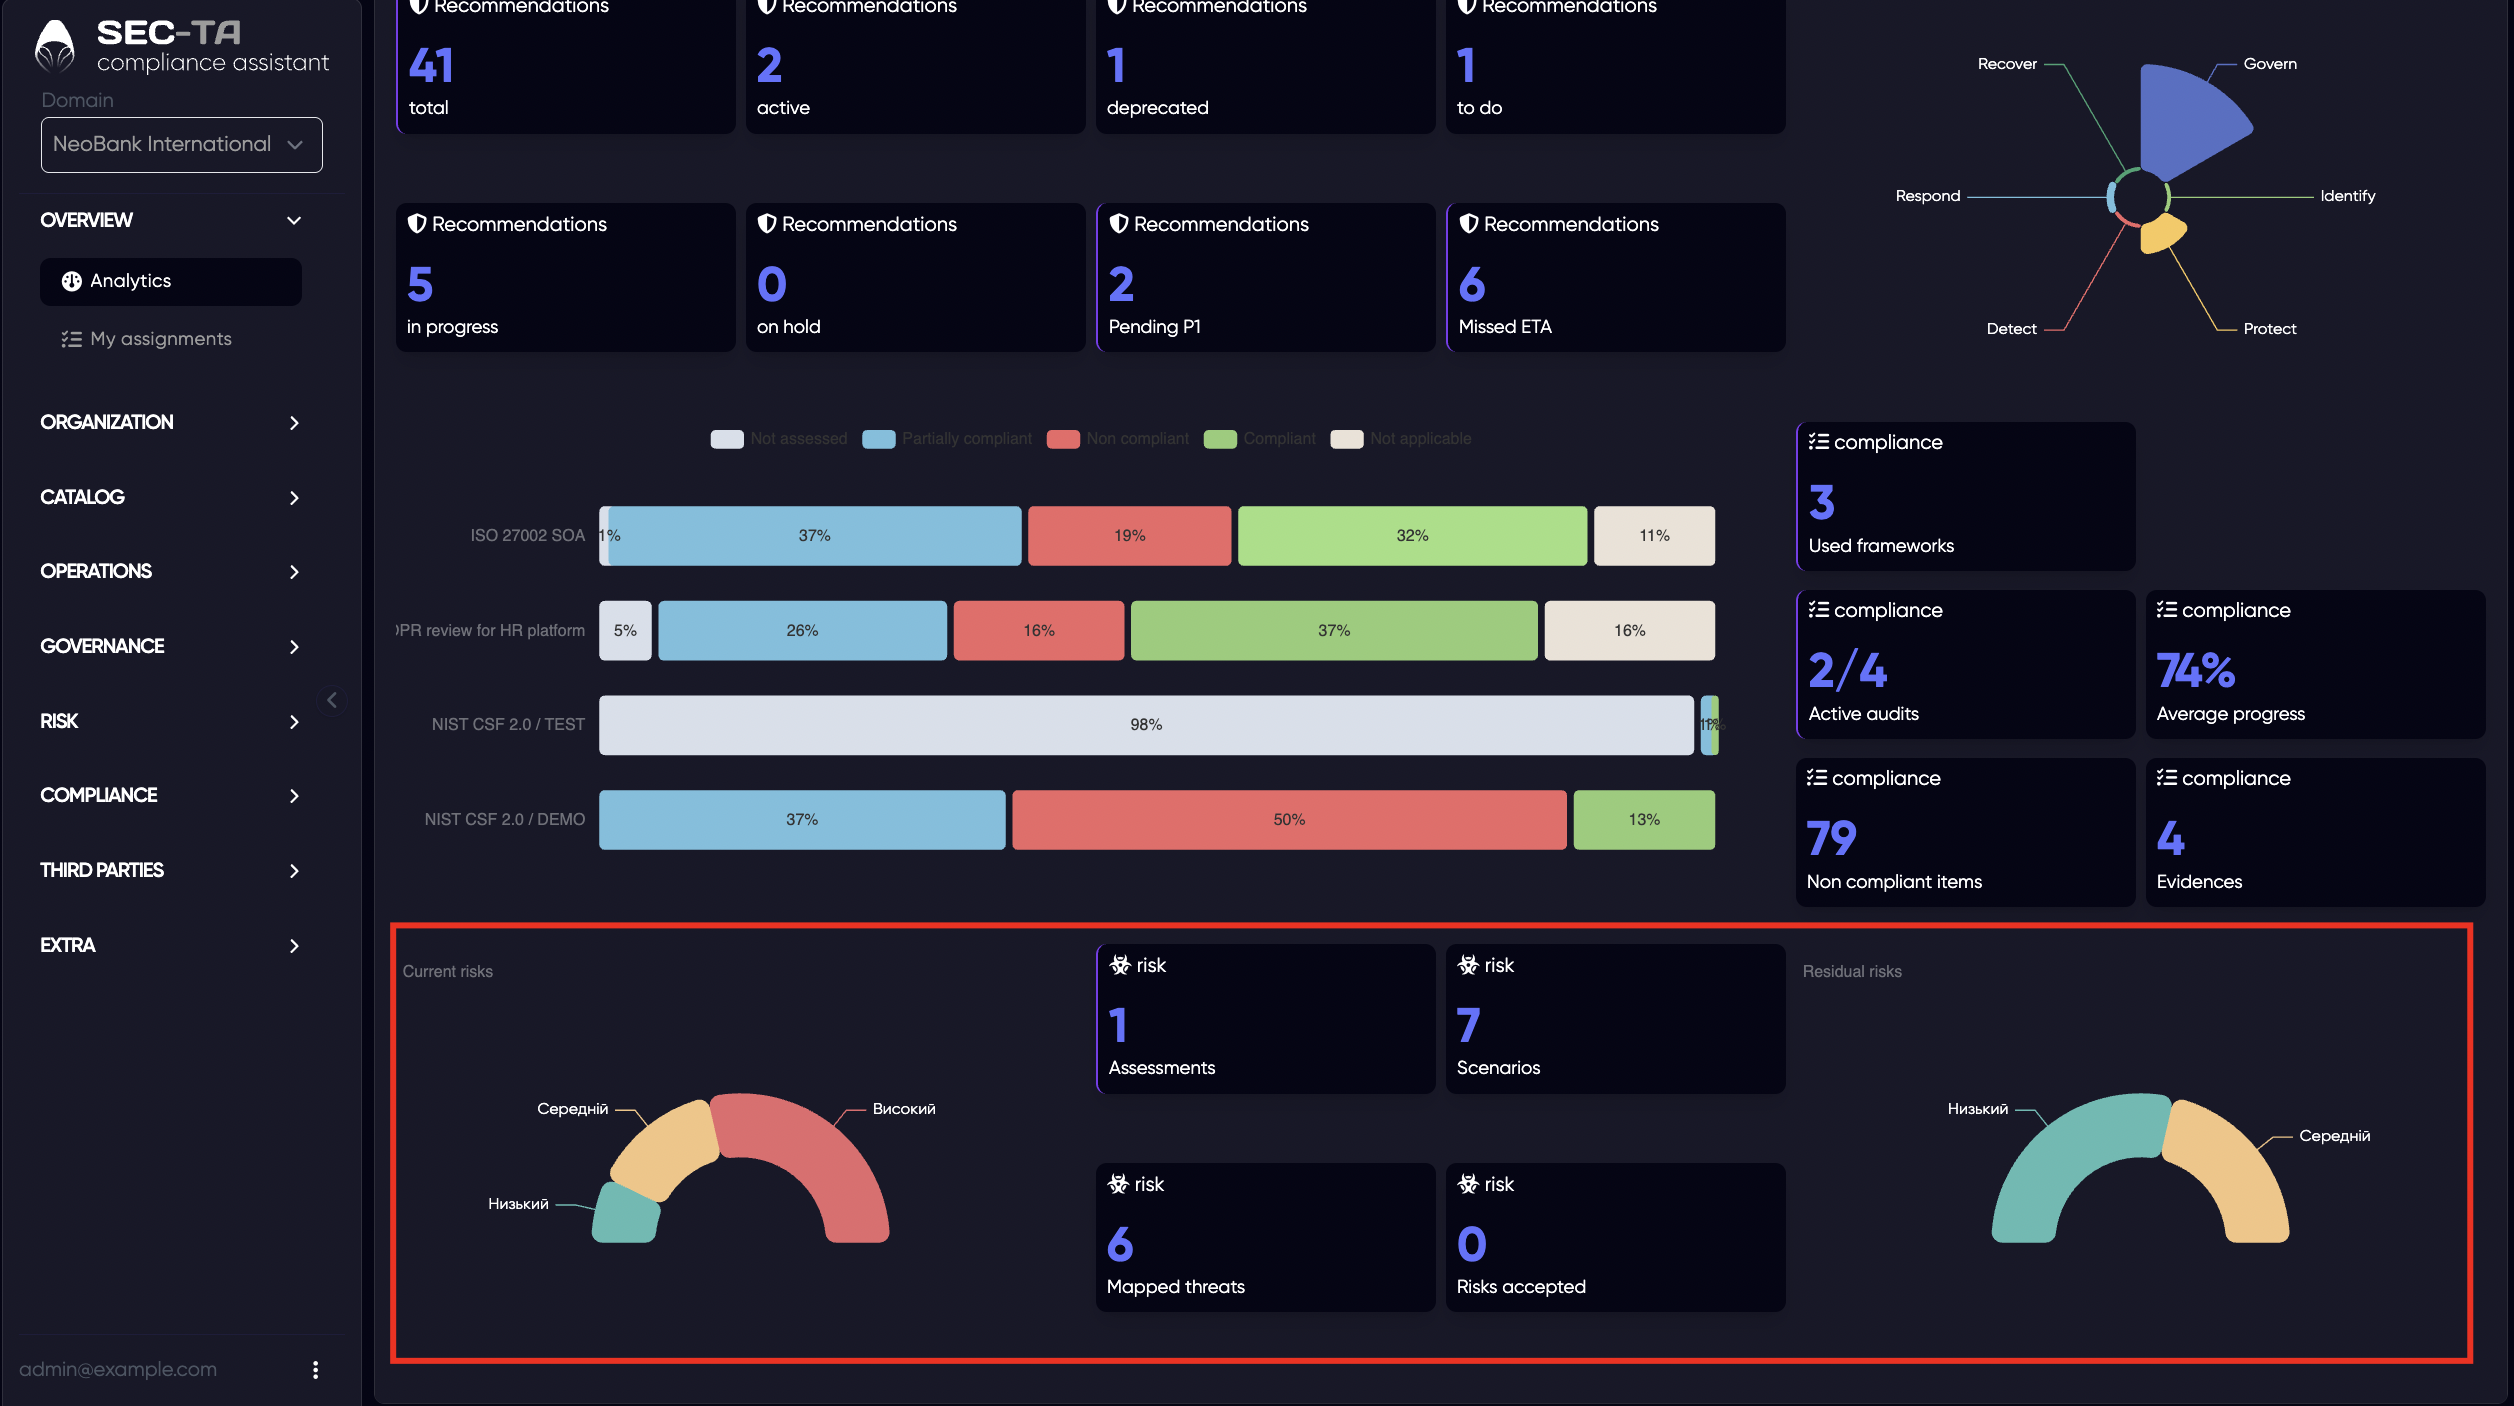
In the lower section of the Summary tab, the dashboard continues with a focus on risk analytics - providing a clear view of the organization’s current and residual risk posture.
The left gauge chart visualizes the current risk distribution, showing how many risks fall into each level:
- Low - minor risks with minimal impact;
- Medium - moderate risks requiring monitoring or mitigation;
- High - significant risks that demand immediate attention or action.
In the center, key indicators summarize the main components of your risk management activities:
- Assessments - the number of risk assessments performed;
- Scenarios - the total number of identified and documented risk scenarios;
- Mapped threats - threats linked to specific assets, controls, or processes;
- Risks accepted - the number of risks formally acknowledged and accepted by management.
On the right side, the second gauge displays the residual risk levels - the risks that remain after applying mitigation measures or controls. This visualization allows you to compare current and residual risks to evaluate how effective your risk treatment strategies are.
¶ Governance
The Governance tab provides insights into the organizational management and control aspects of your cybersecurity program. It helps you understand how policies, audits, and frameworks are structured and applied across different domains.
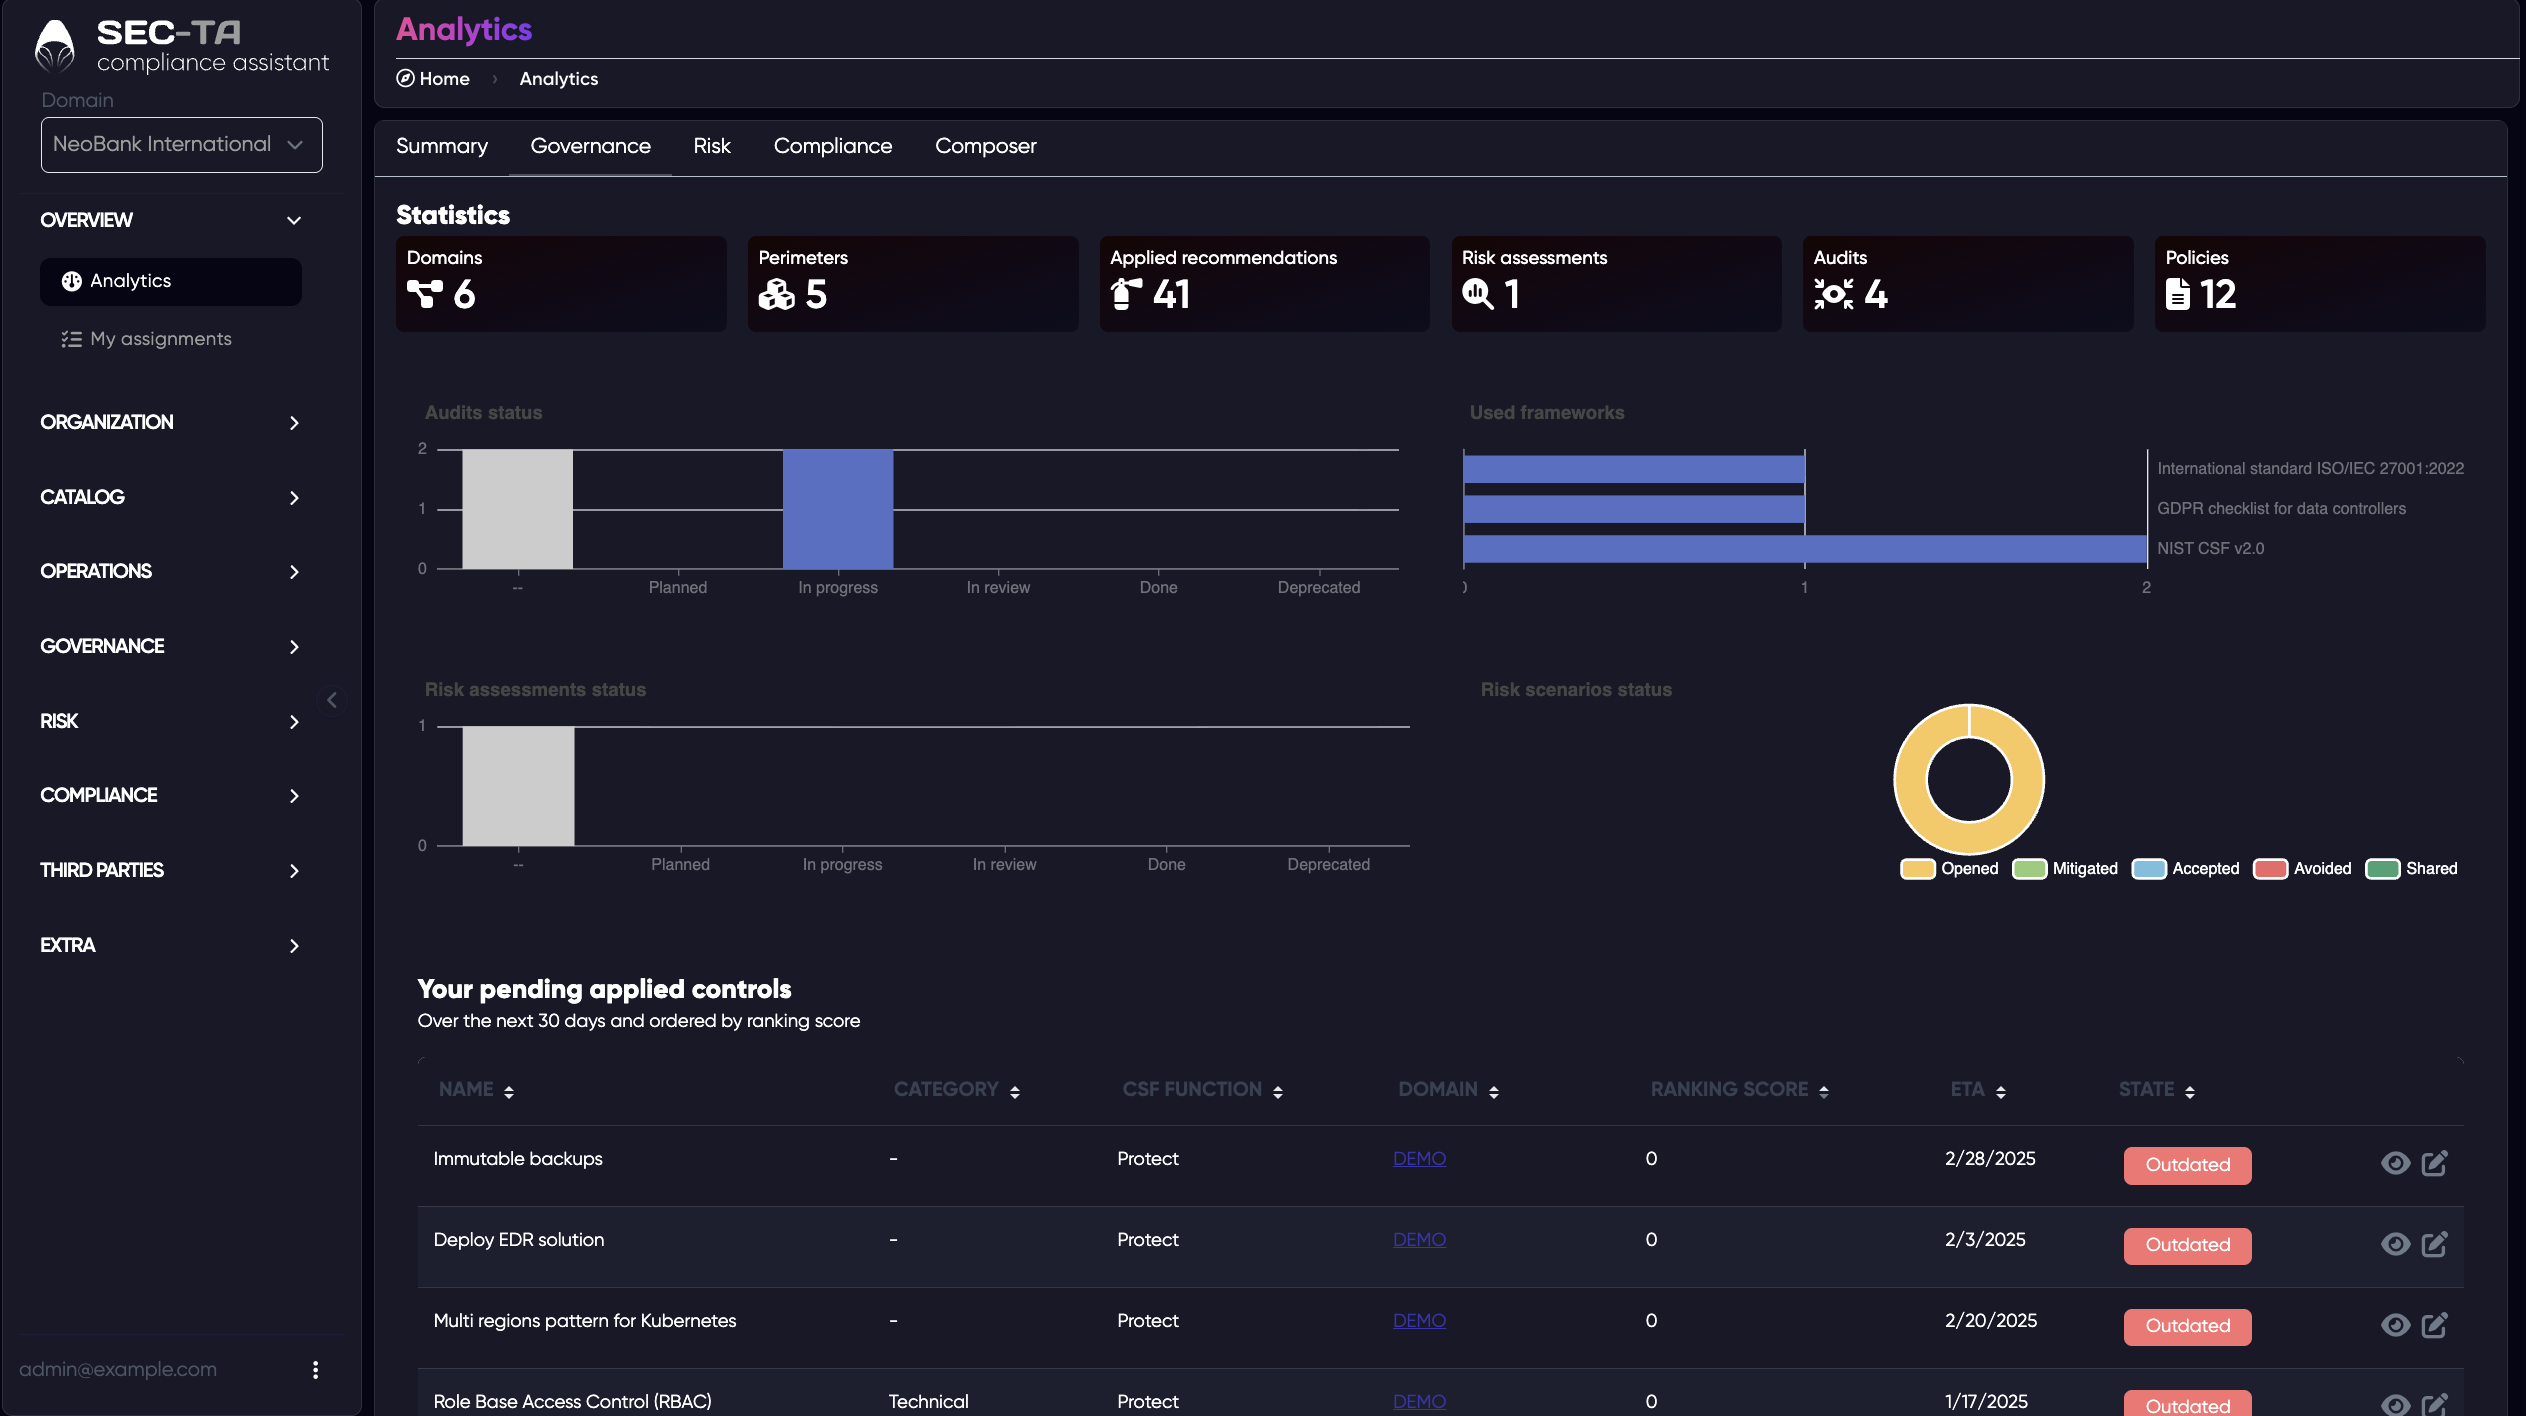
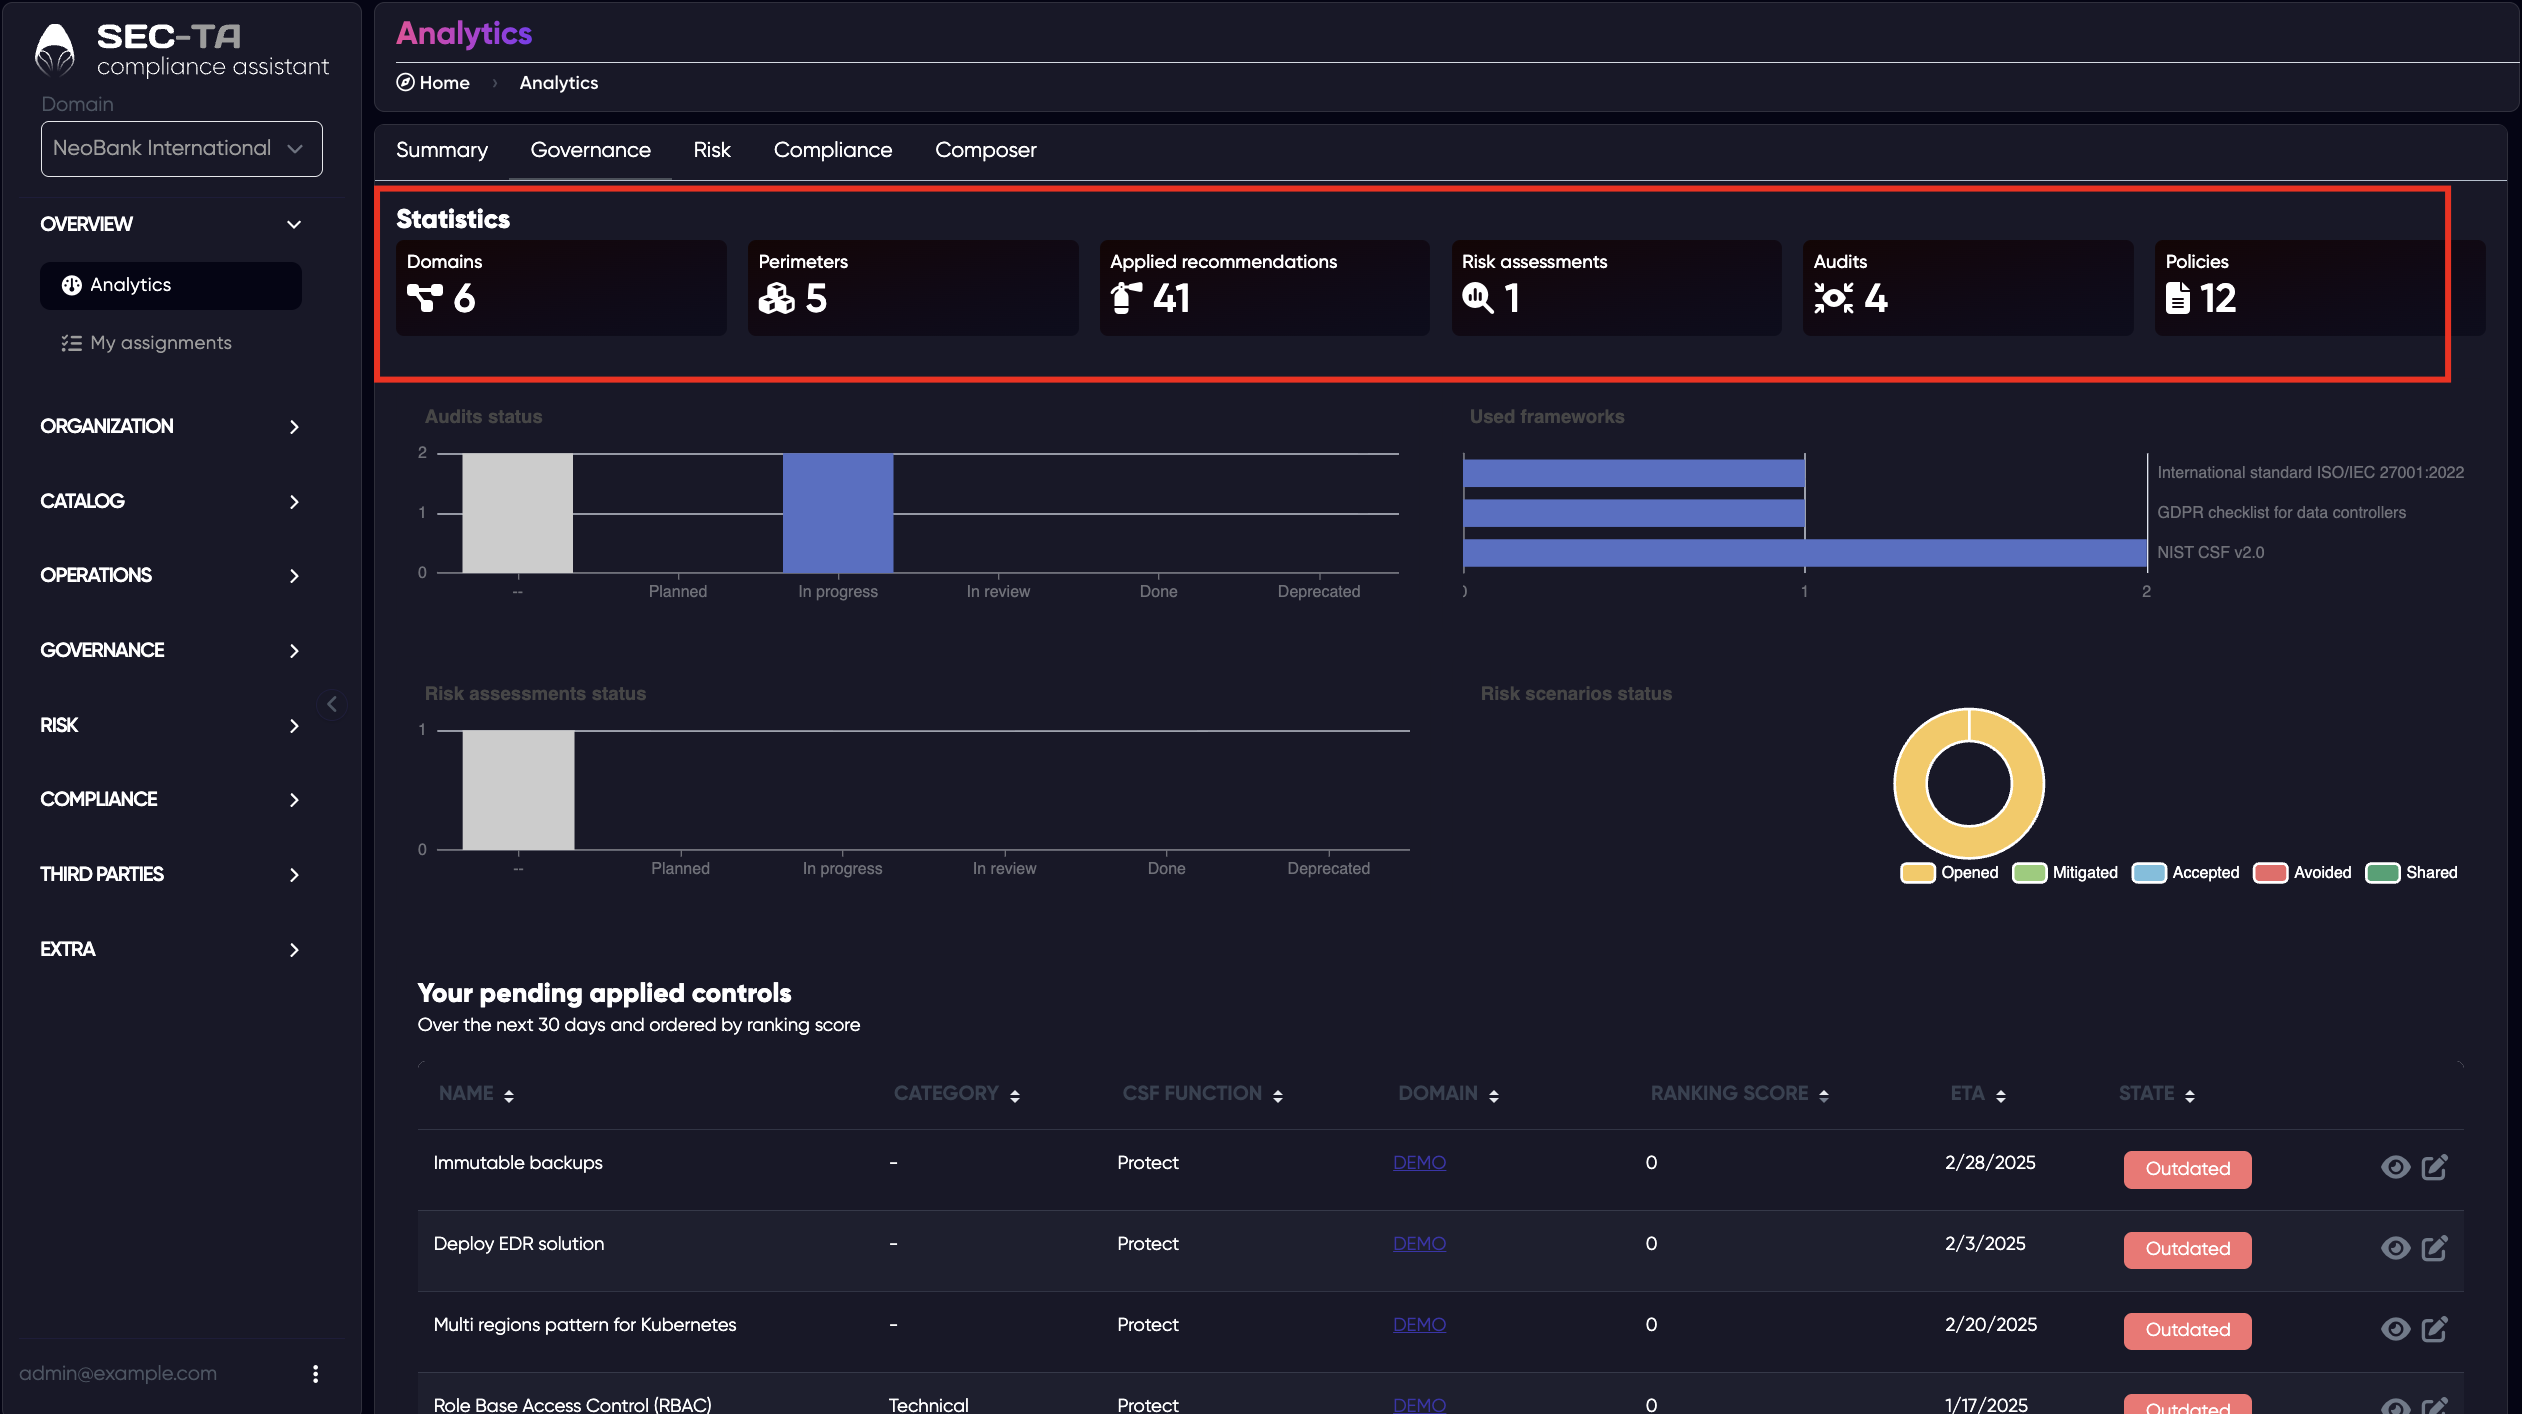
Key statistics such as the total number of domains, perimeters, audits, policies, and risk assessments — providing an overview of the organization’s structure and ongoing activities.
Each indicator is clickable, allowing you to quickly access detailed lists and explore related data. You can click on any of the following metrics to open their corresponding pages:
- Domains - view the full list of existing domains and their details.
- Perimeters - see defined network or organizational perimeters.
- Applied recommendations - check all implemented or pending improvement actions.
- Risk assessments - open the list of completed or active risk assessments.
- Audits - view ongoing or finished audits with their current statuses.
- Policies - access the list of policies applied across the organization.
Audit and assessment status charts showing which processes are planned, in progress, under review, or completed. Framework usage overview, highlighting which standards (e.g., ISO/IEC 27001, GDPR, NIST CSF 2.0) are currently being applied. Risk scenario chart displaying how risks are handled - whether they are opened, mitigated, accepted, avoided, or shared.
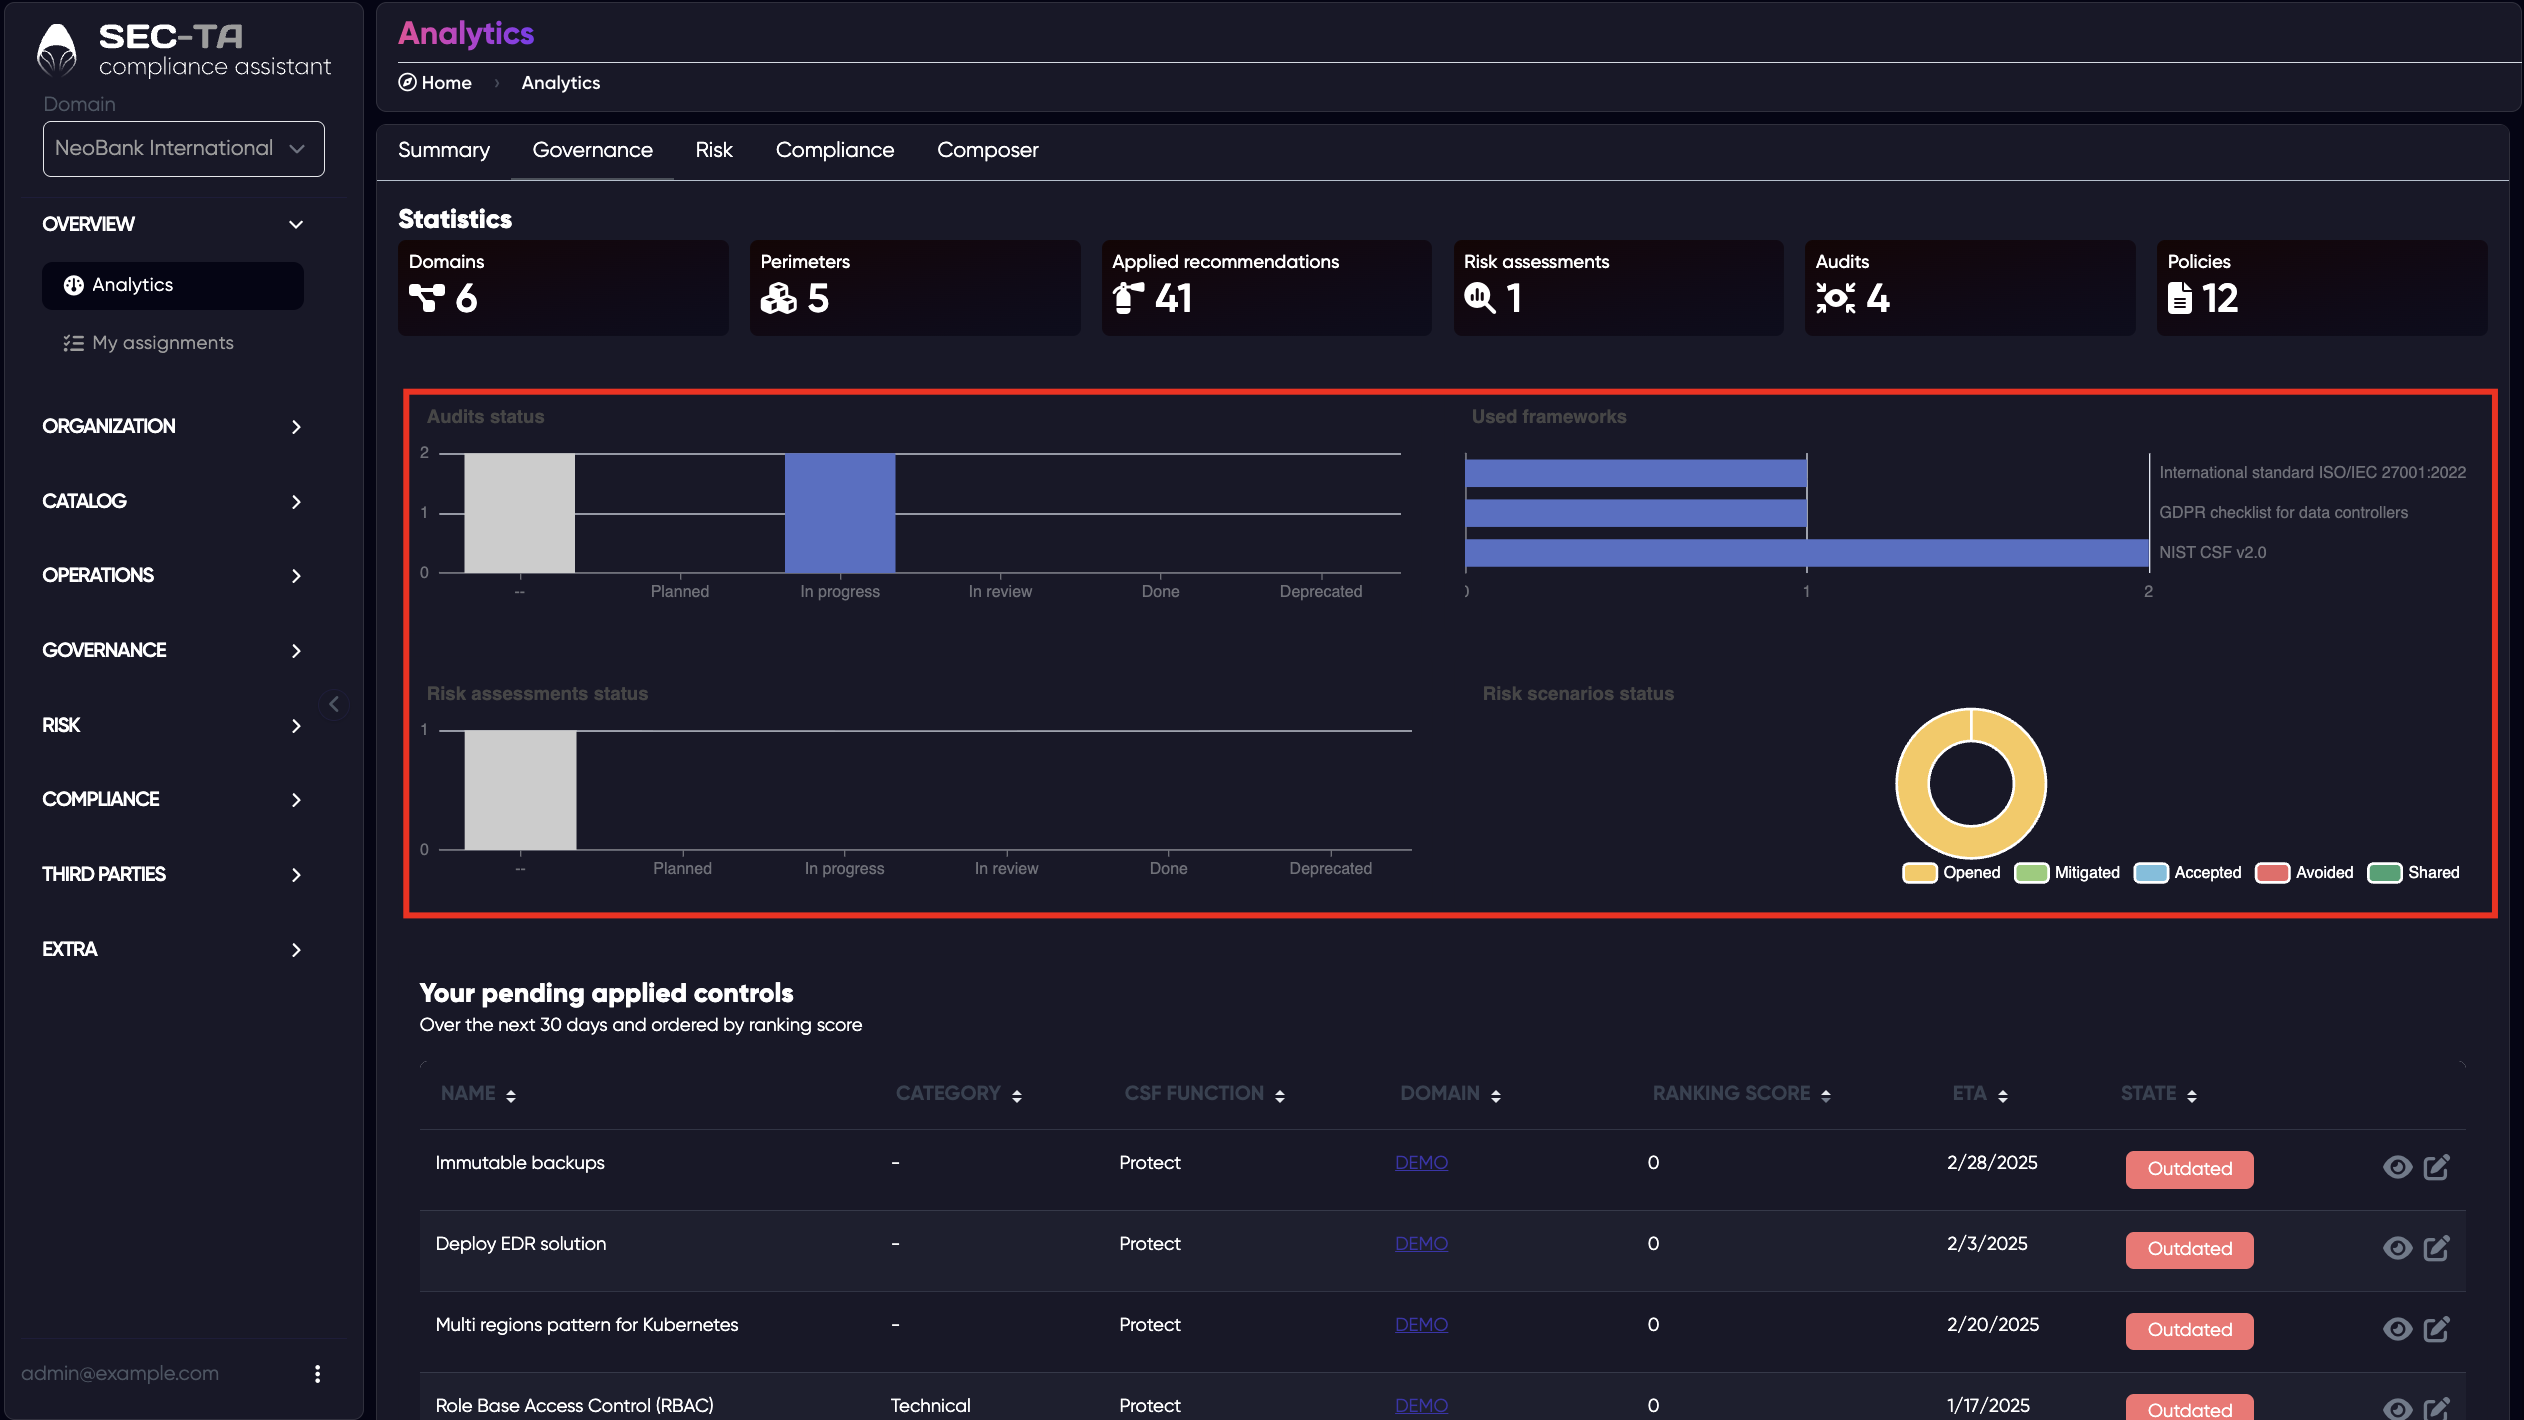
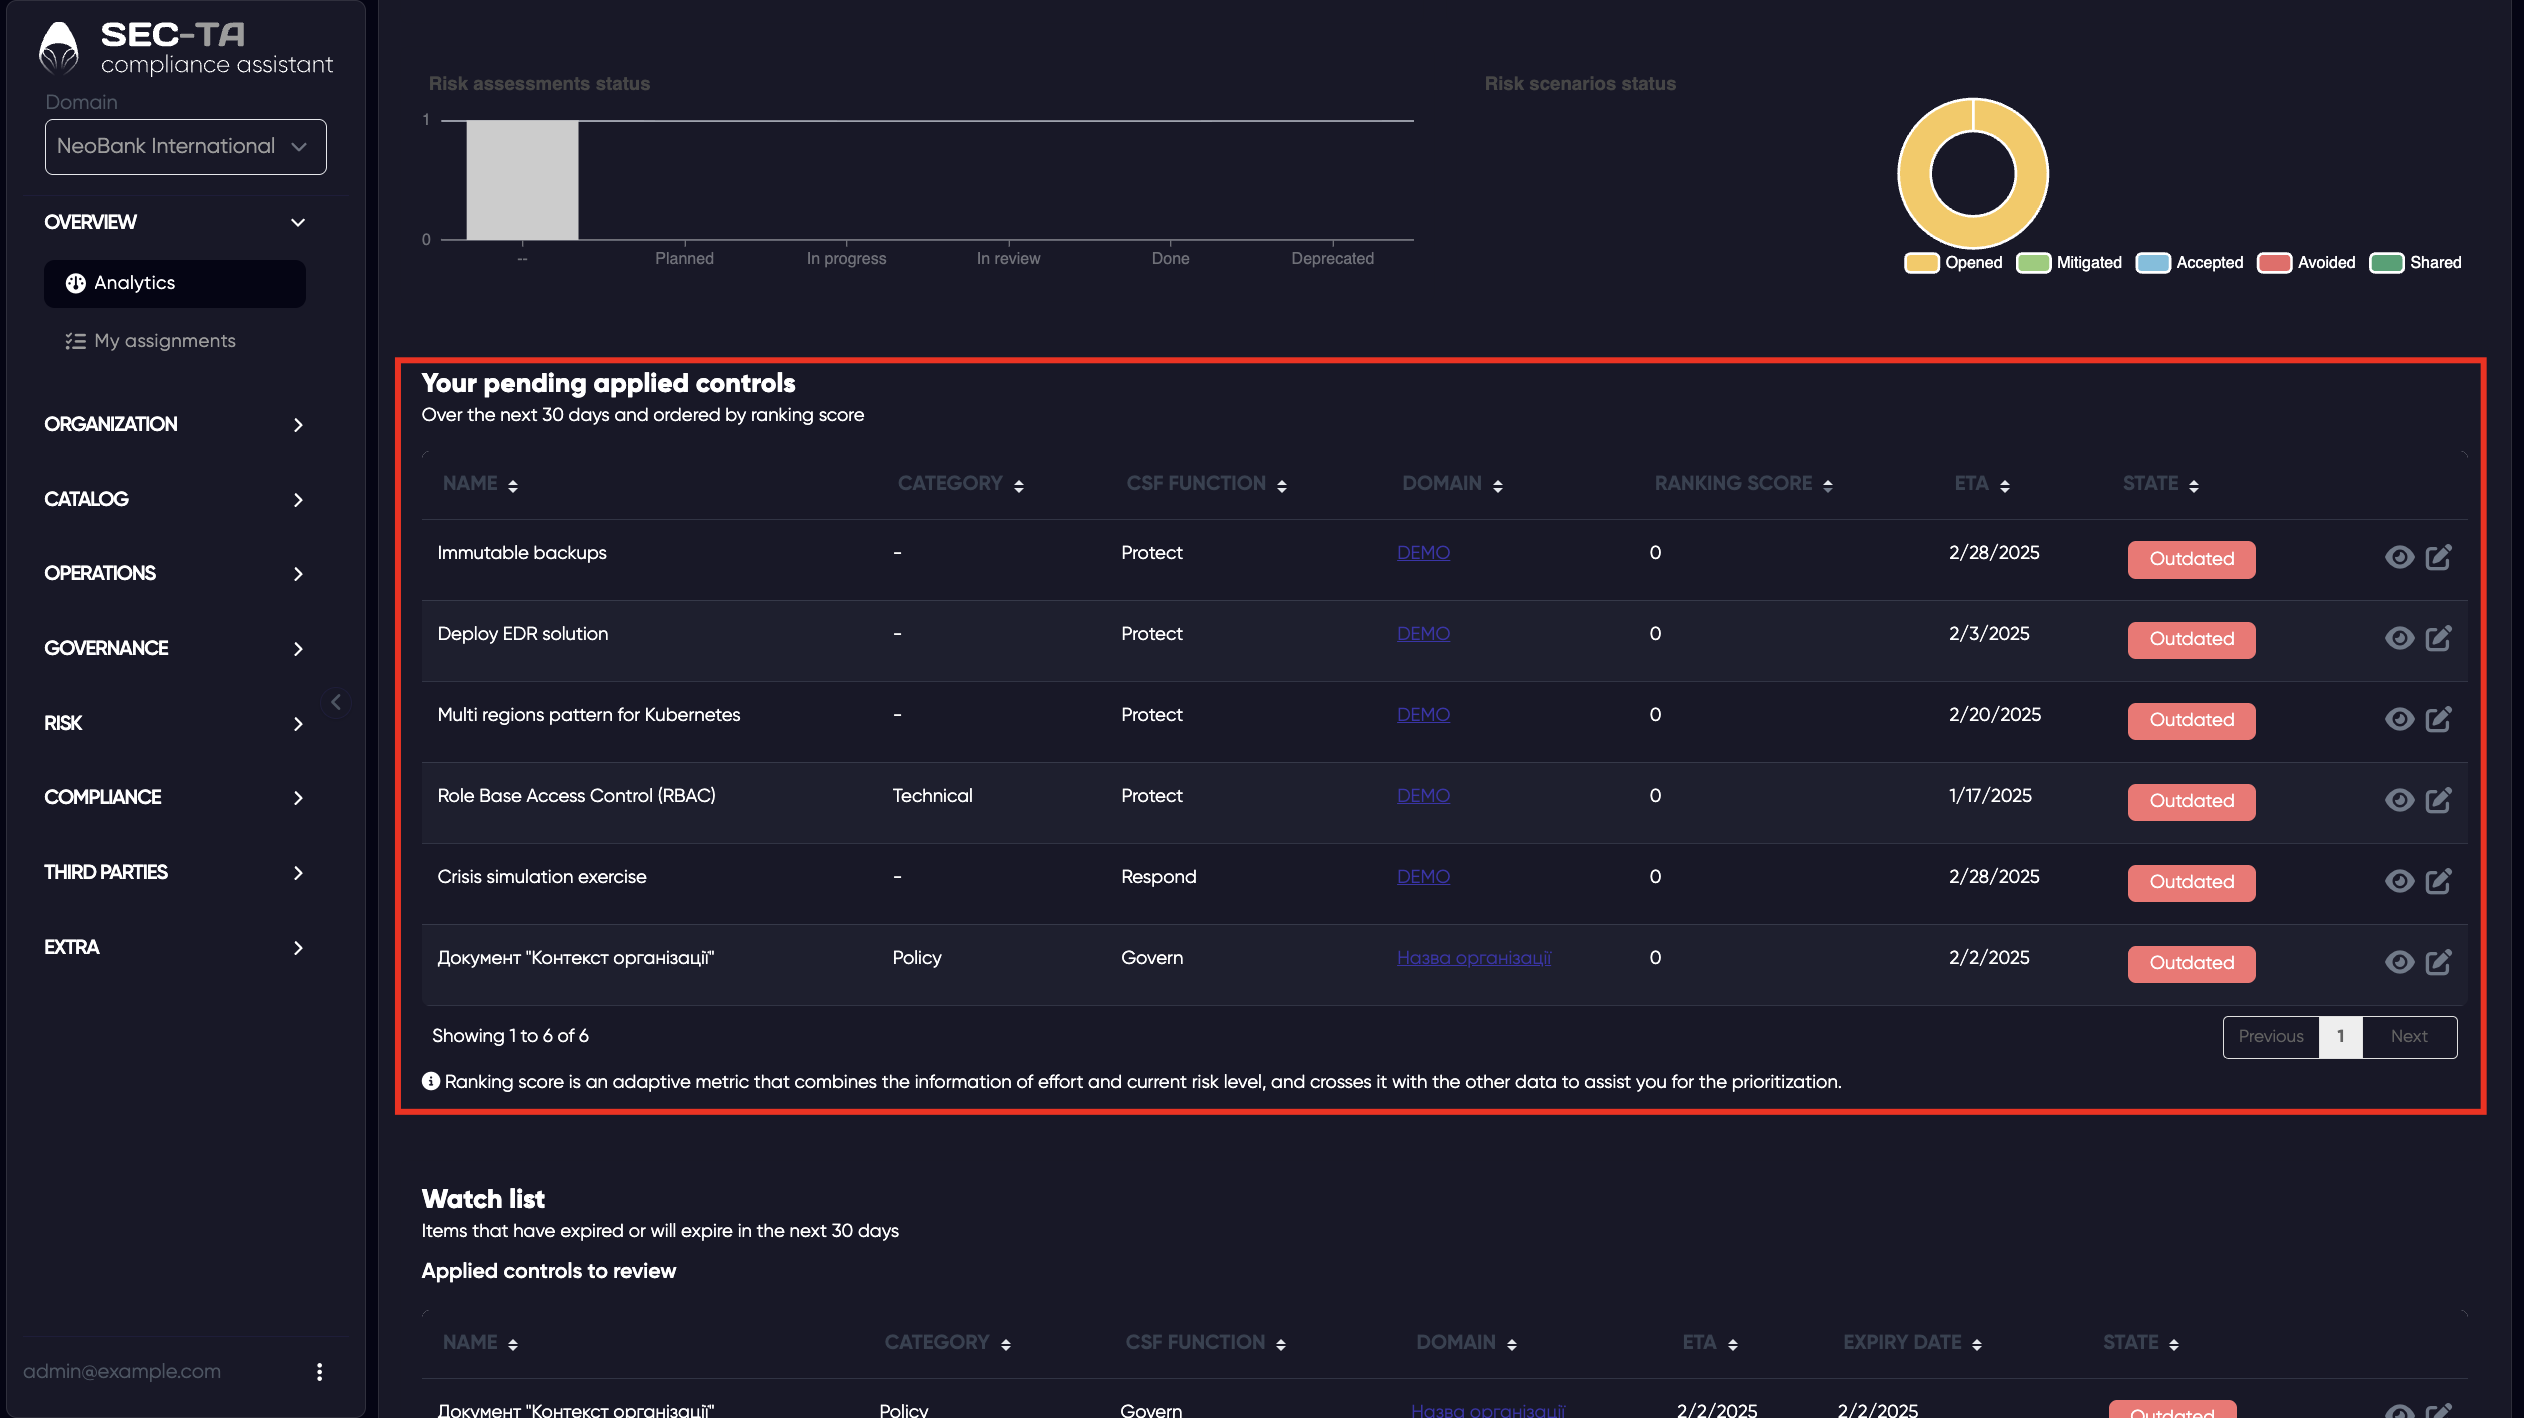
Pending applied controls list, showing upcoming or overdue security measures with their ETA (expected completion date) and current state.
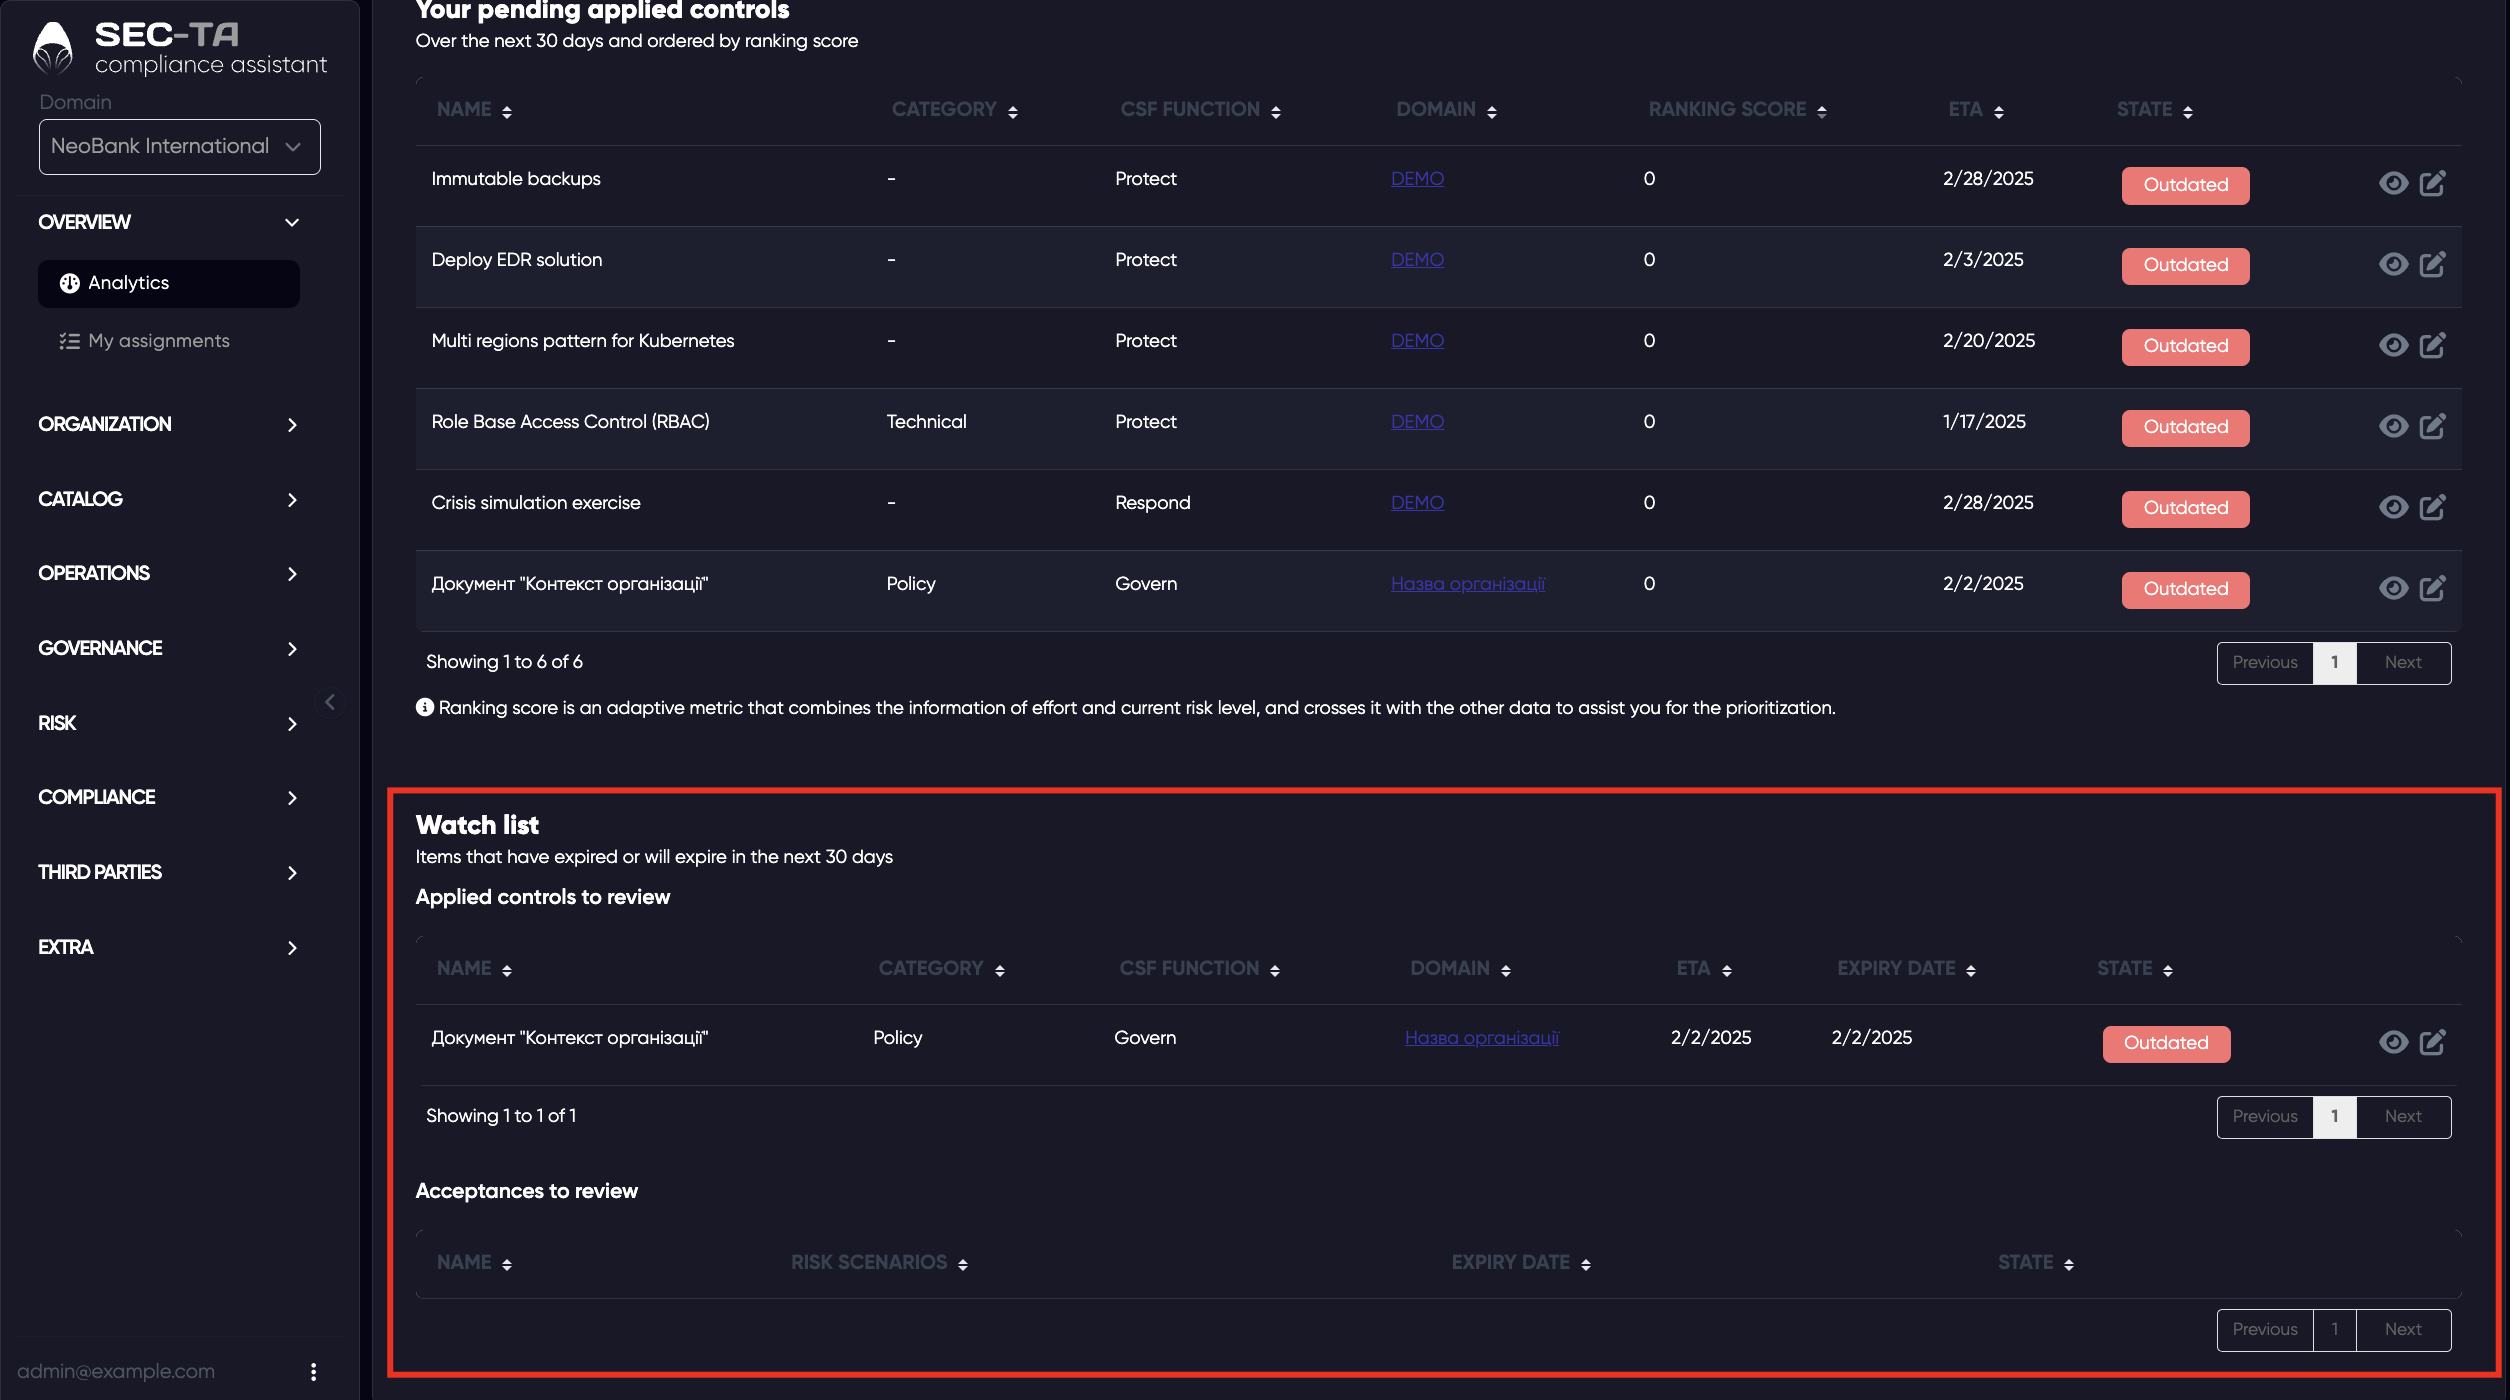
The Watch list helps you track items that have expired or are about to expire within the next 30 days. It ensures that important governance elements such as policies, controls, or risk acceptances are reviewed and updated on time, preventing gaps in compliance or outdated documentation.
¶ Risk
The Risk tab provides a centralized overview of all risks across every domain (organization) in the system. Here, you can view current and residual risk levels, analyze how threats such as data loss, unavailability, or ransomware affect different domains, and assess how effectively controls are mitigating those risks.
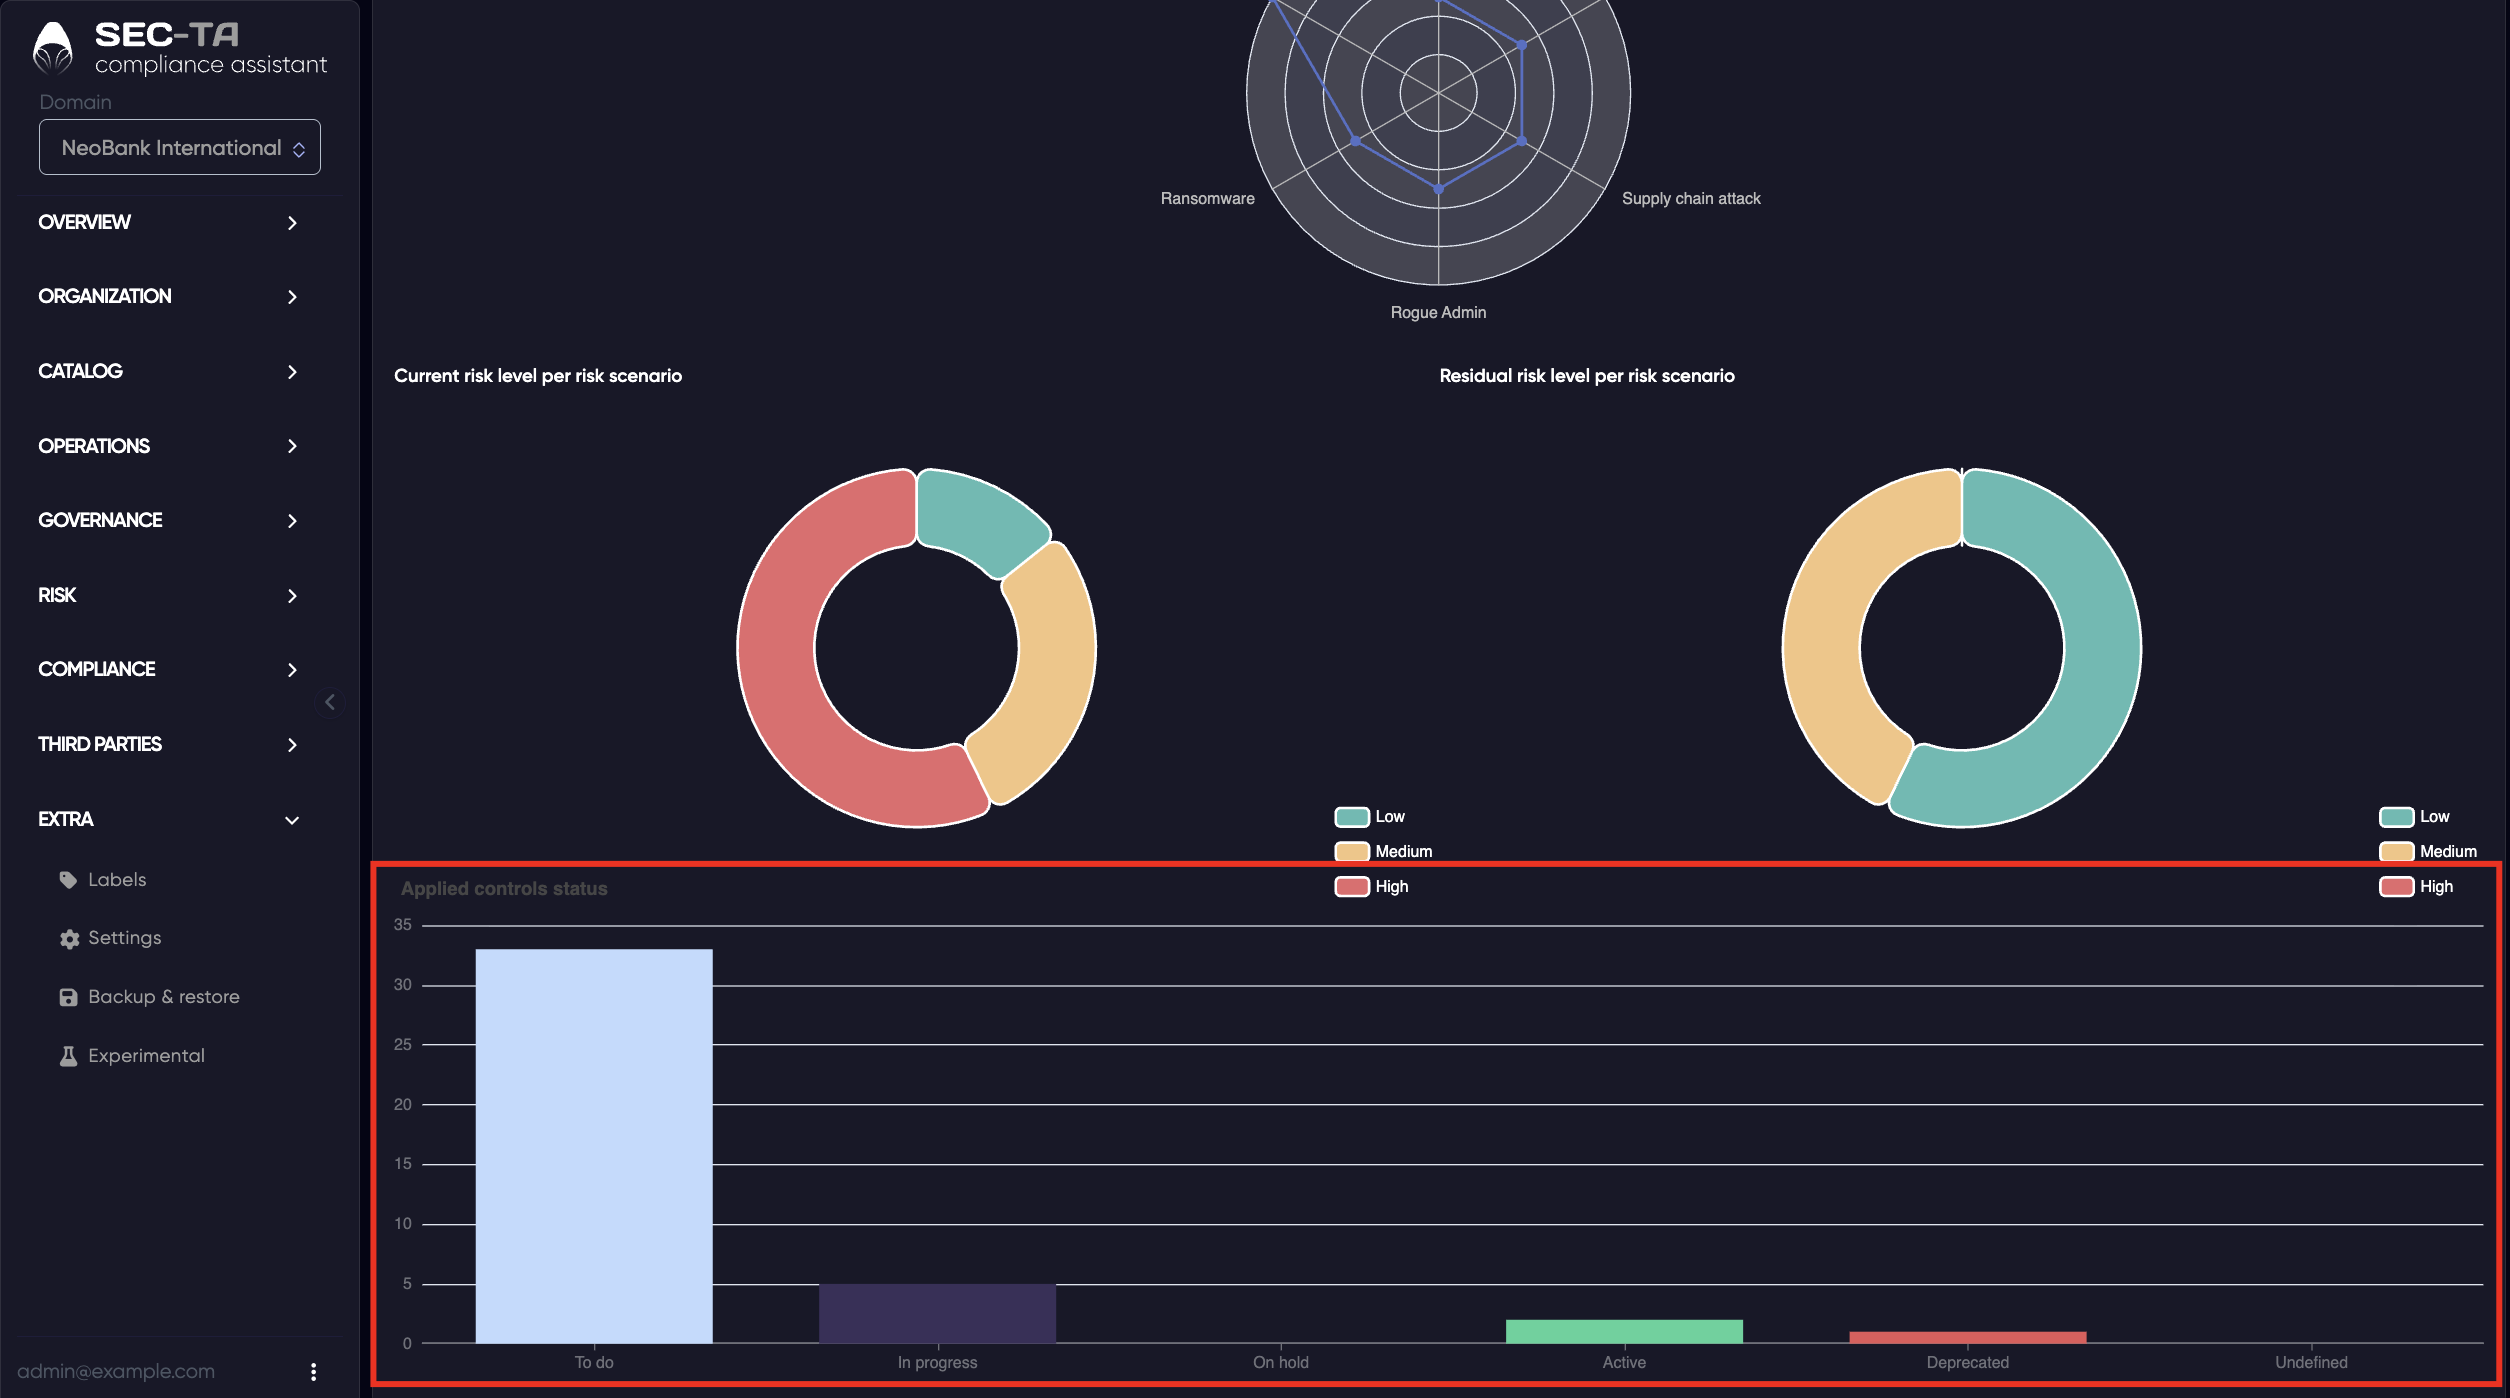
Threat radar - a graphical overview of major risk areas such as data loss, unavailability, ransomware, supply chain attacks, and insider threats (e.g., rogue admin). It visually highlights which types of risks have the greatest impact.
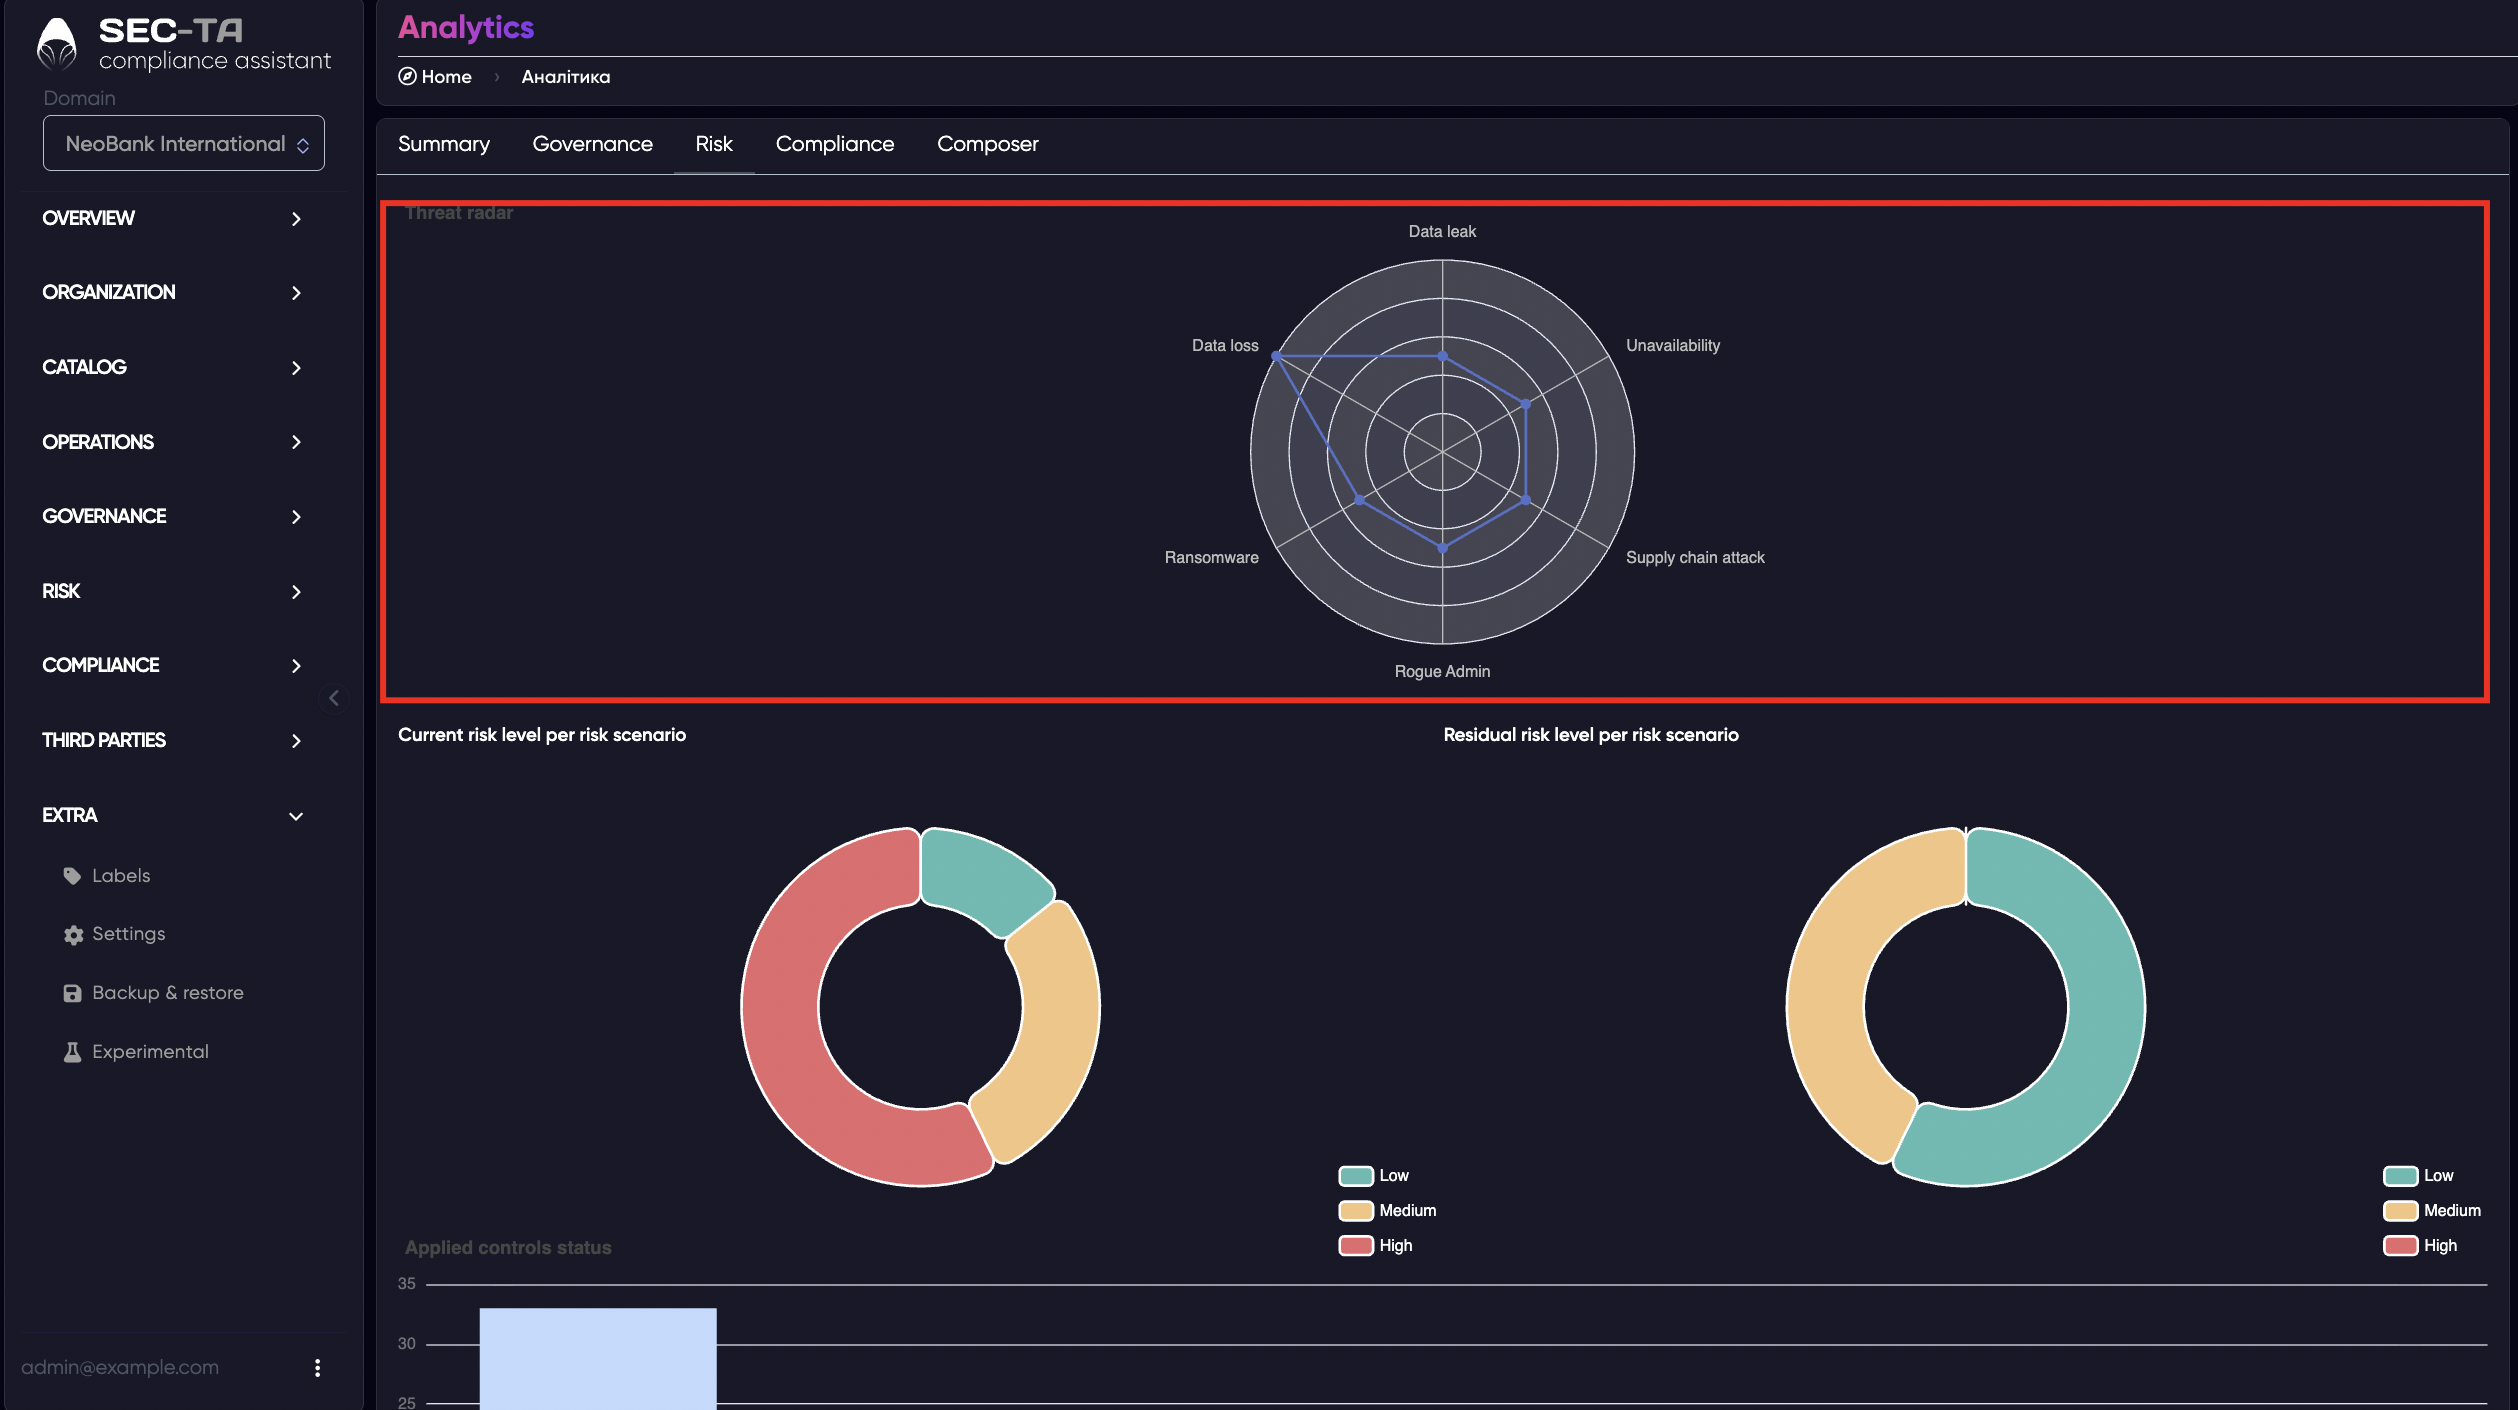
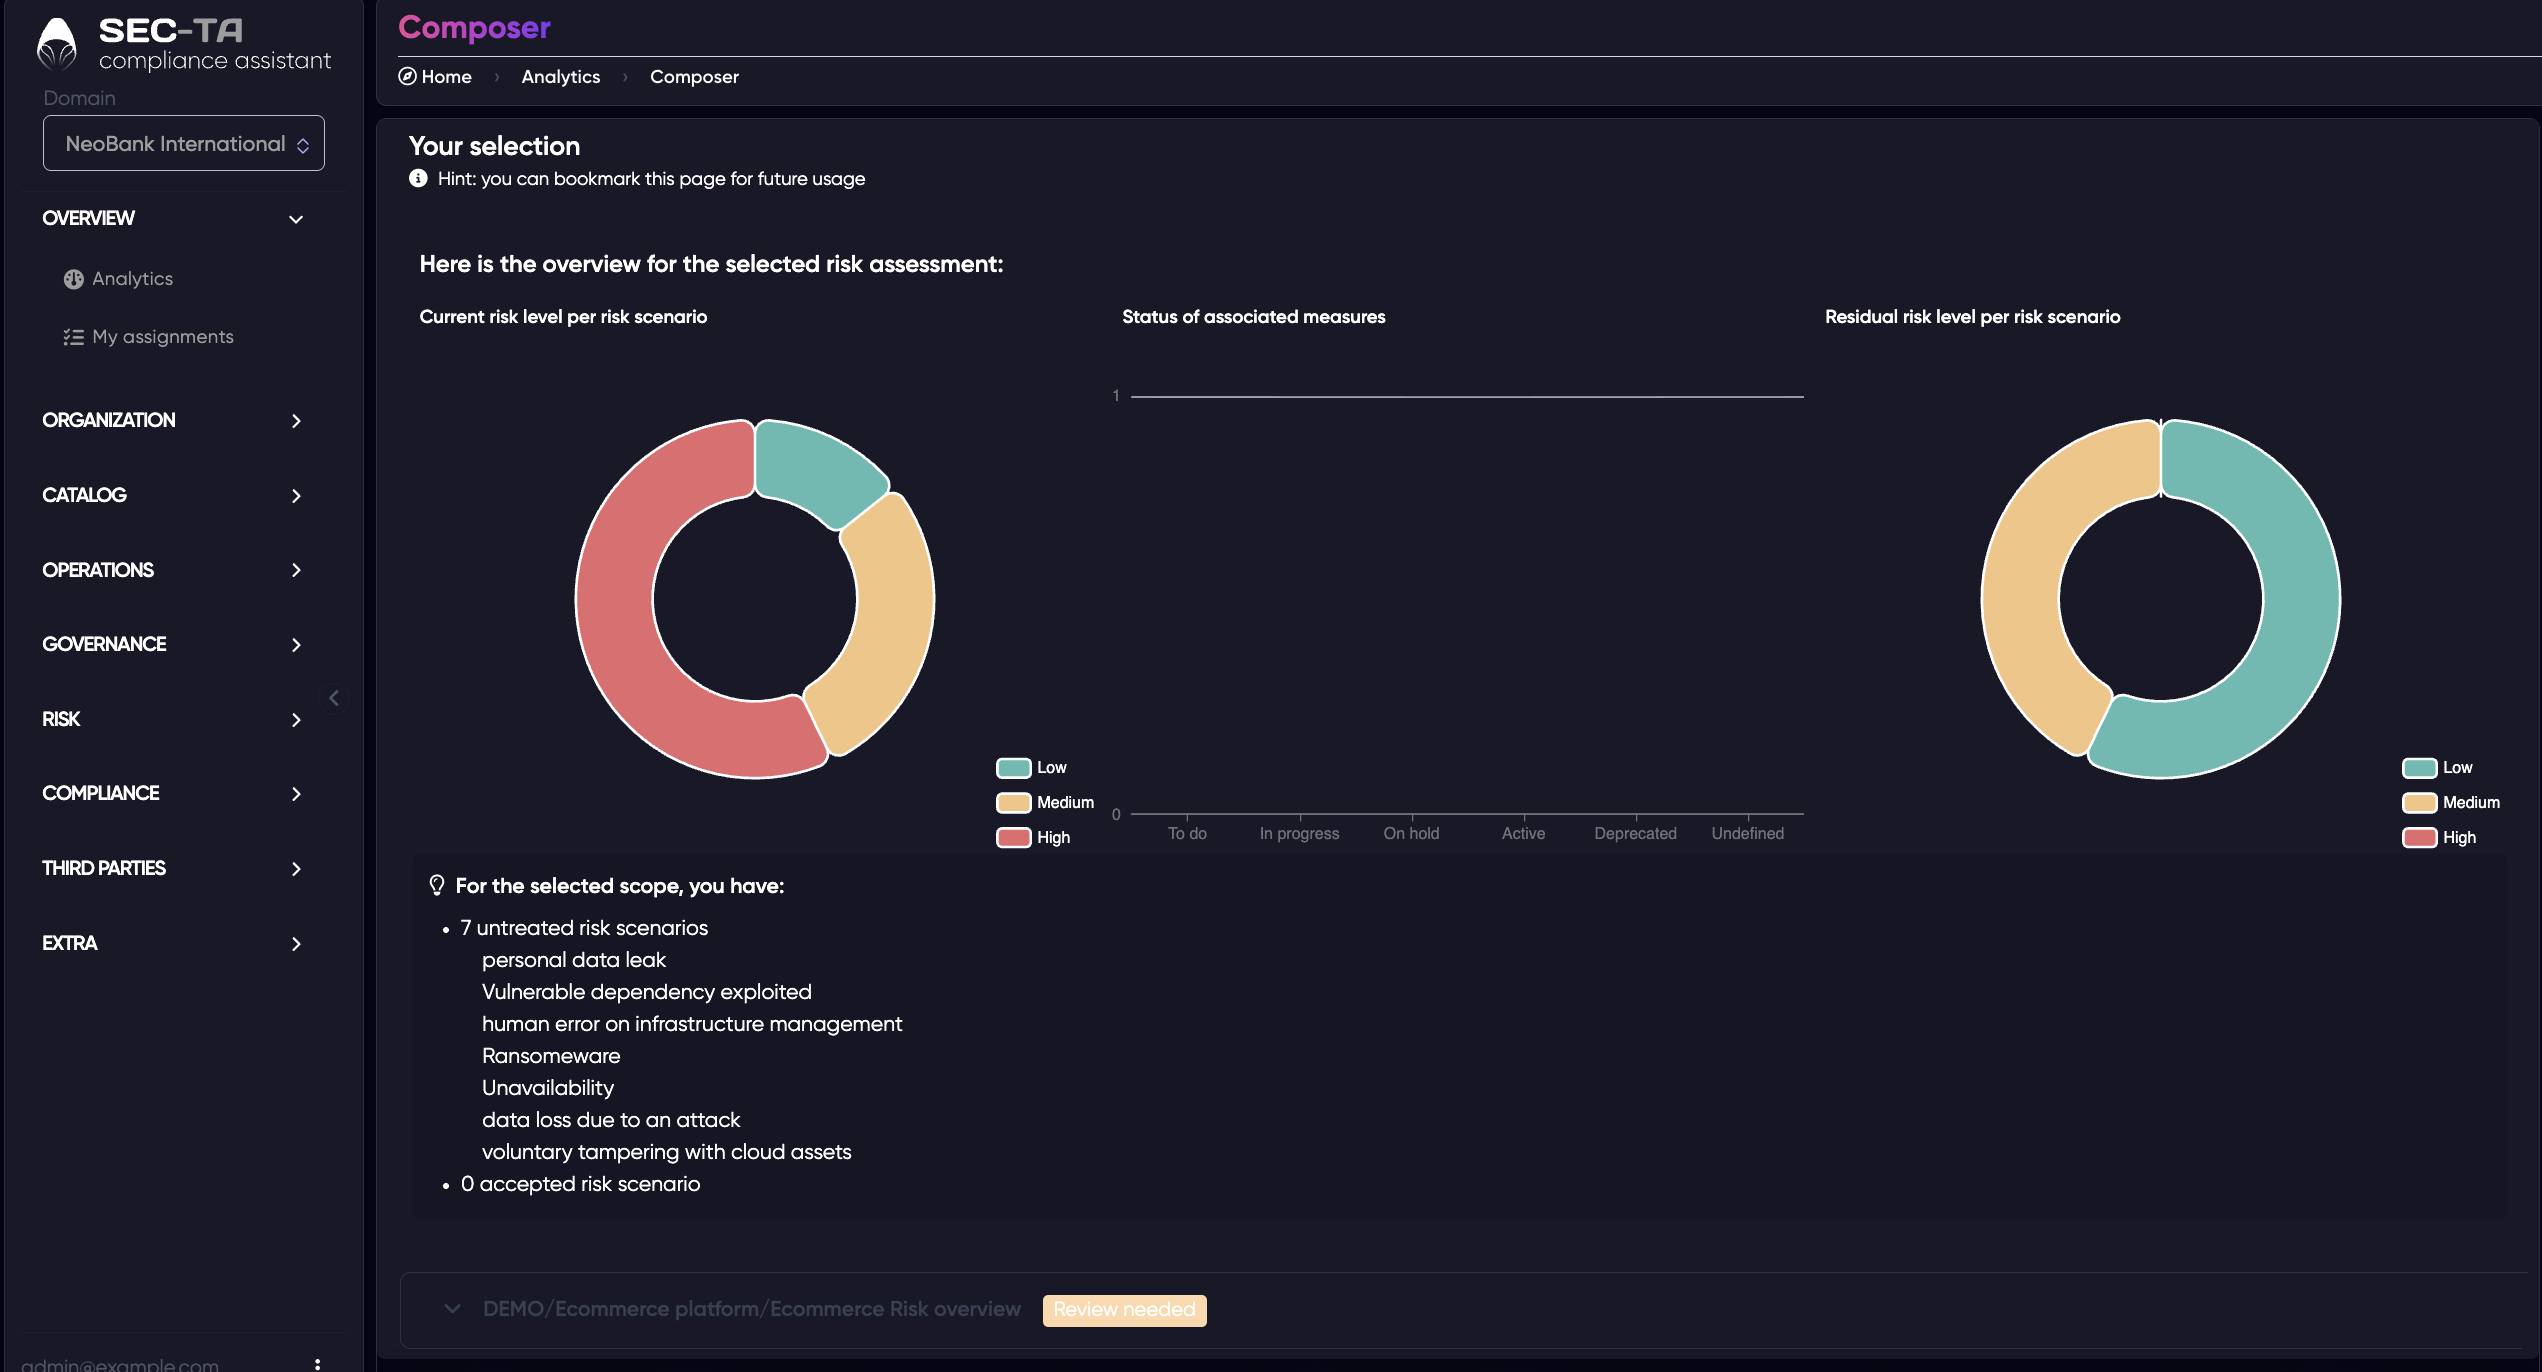
Current risk level per scenario - a donut chart that displays the current risk distribution by level (Low, Medium, High).
Residual risk level per scenario - another chart showing how much risk remains after mitigation measures have been applied, allowing comparison with current risks.
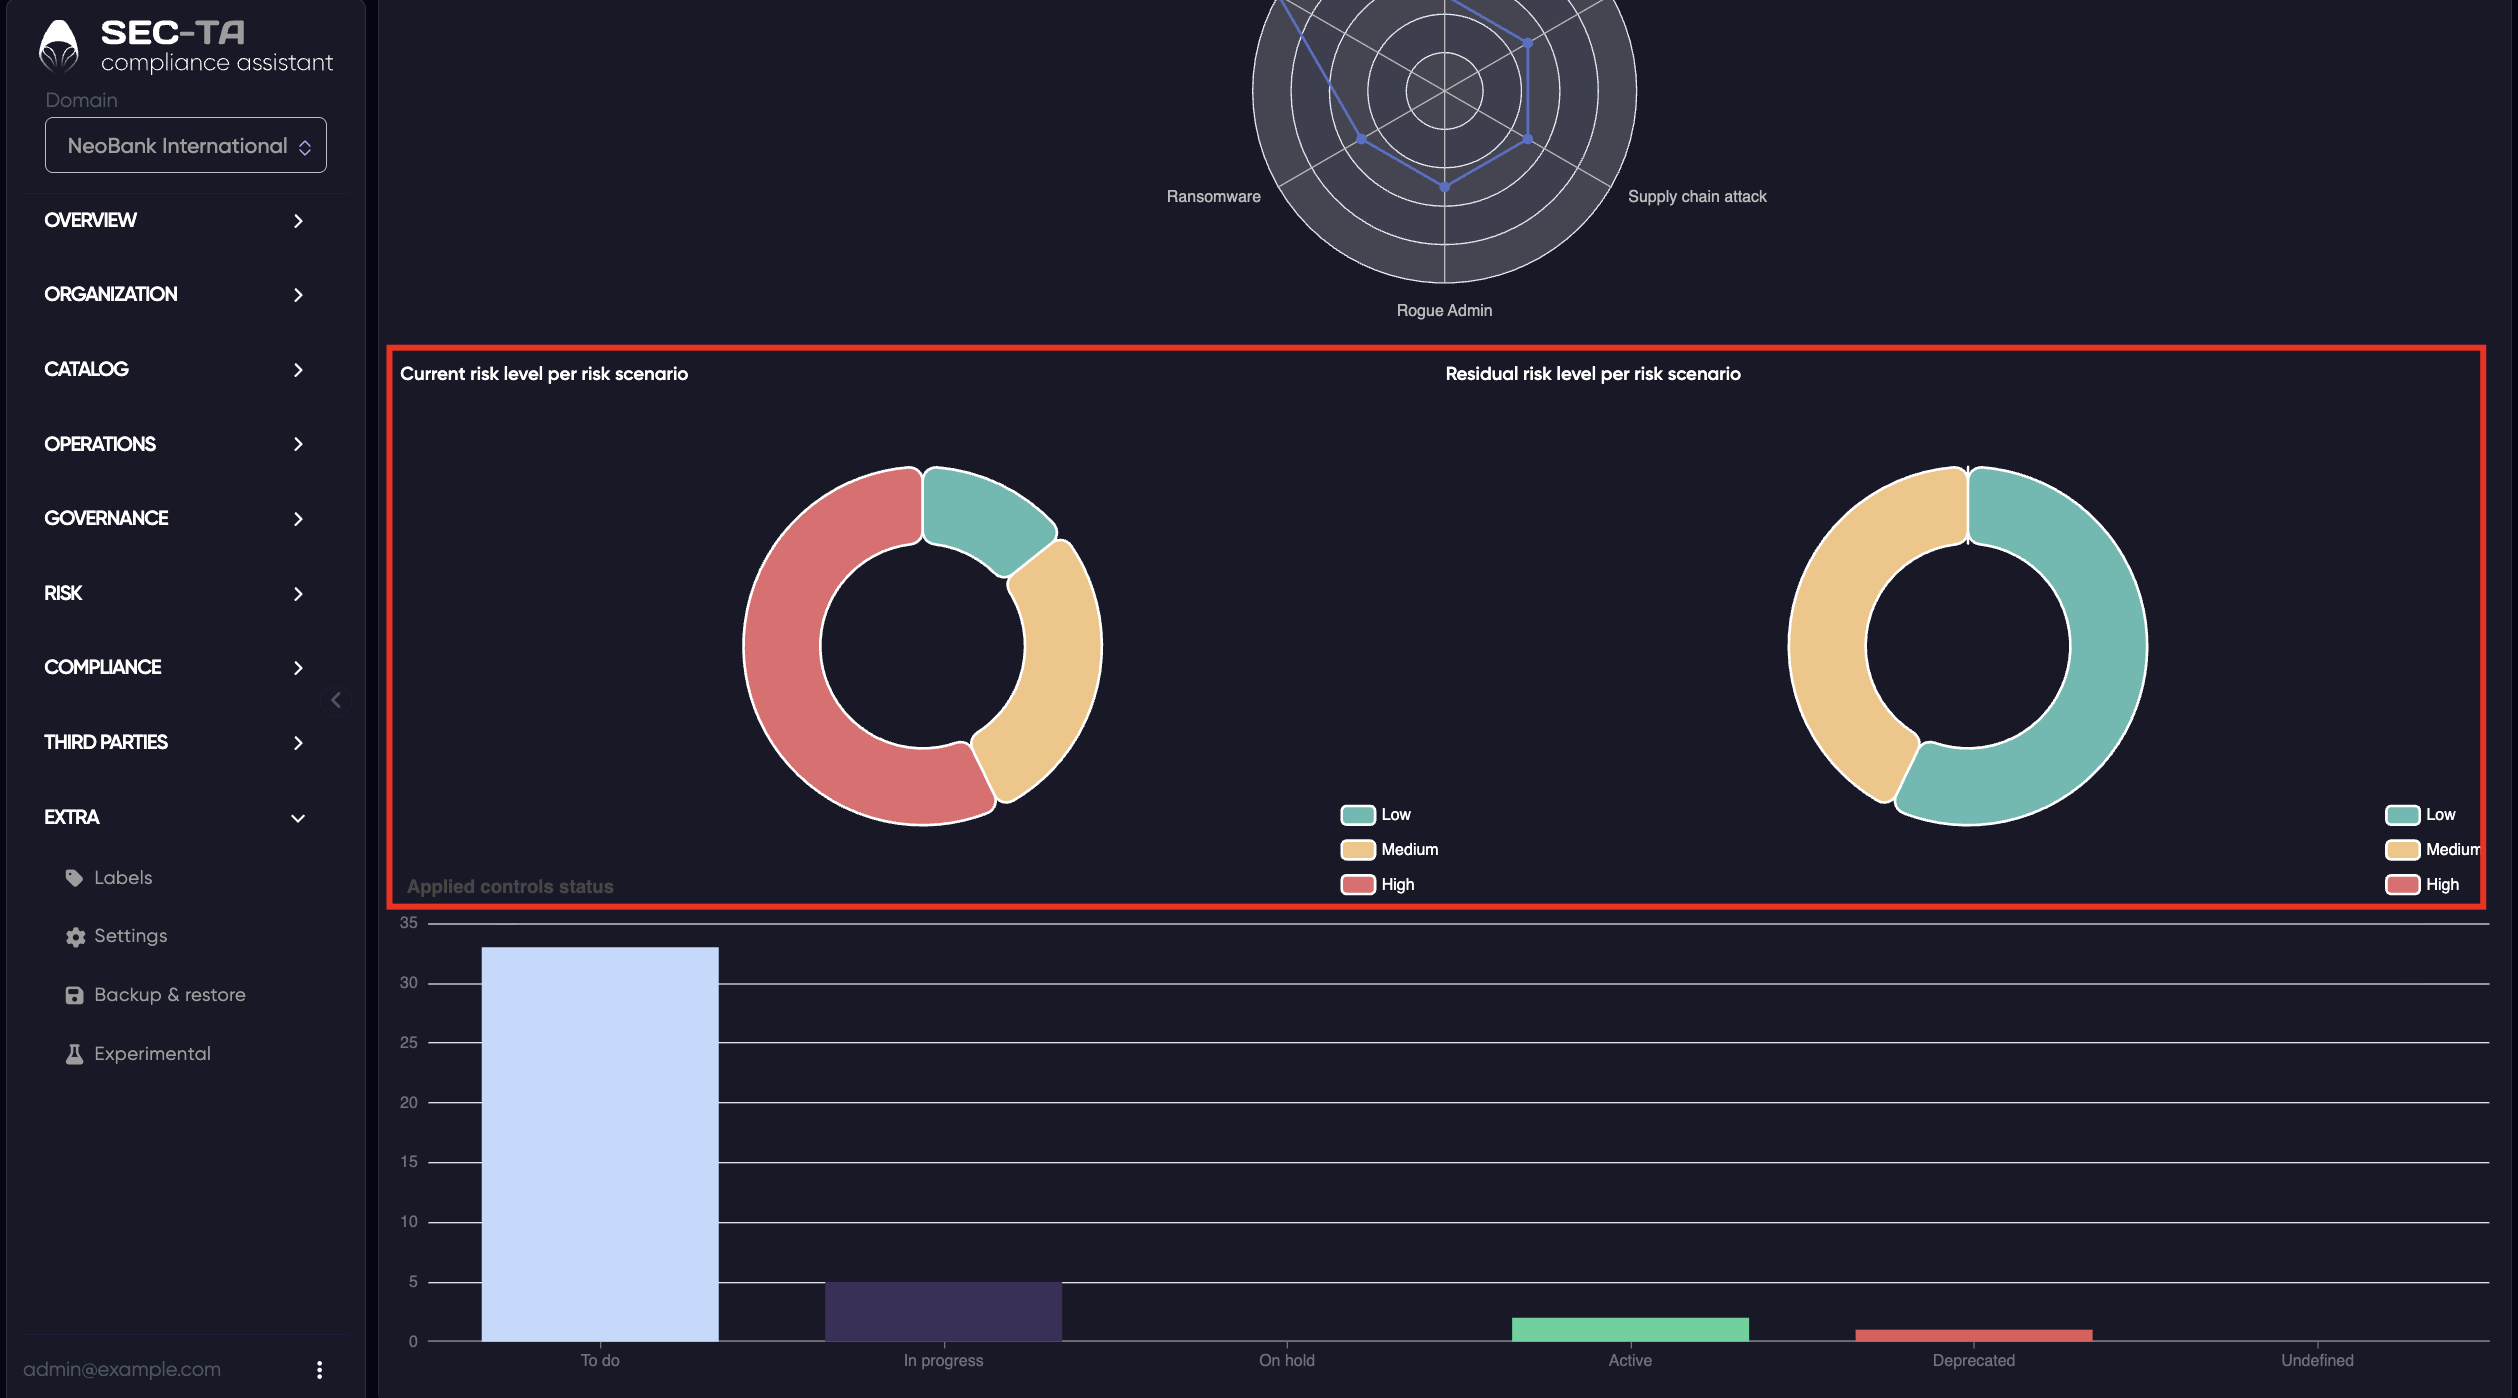
The Applied controls status chart displays the overall progress of all security controls implemented across domains.
Each bar represents a specific control state - To do, In progress, On hold, Active, Deprecated, or Undefined - showing how many controls fall into each category.
¶ Compliance
The Compliance tab provides a summary report for each audit conducted across all domains.
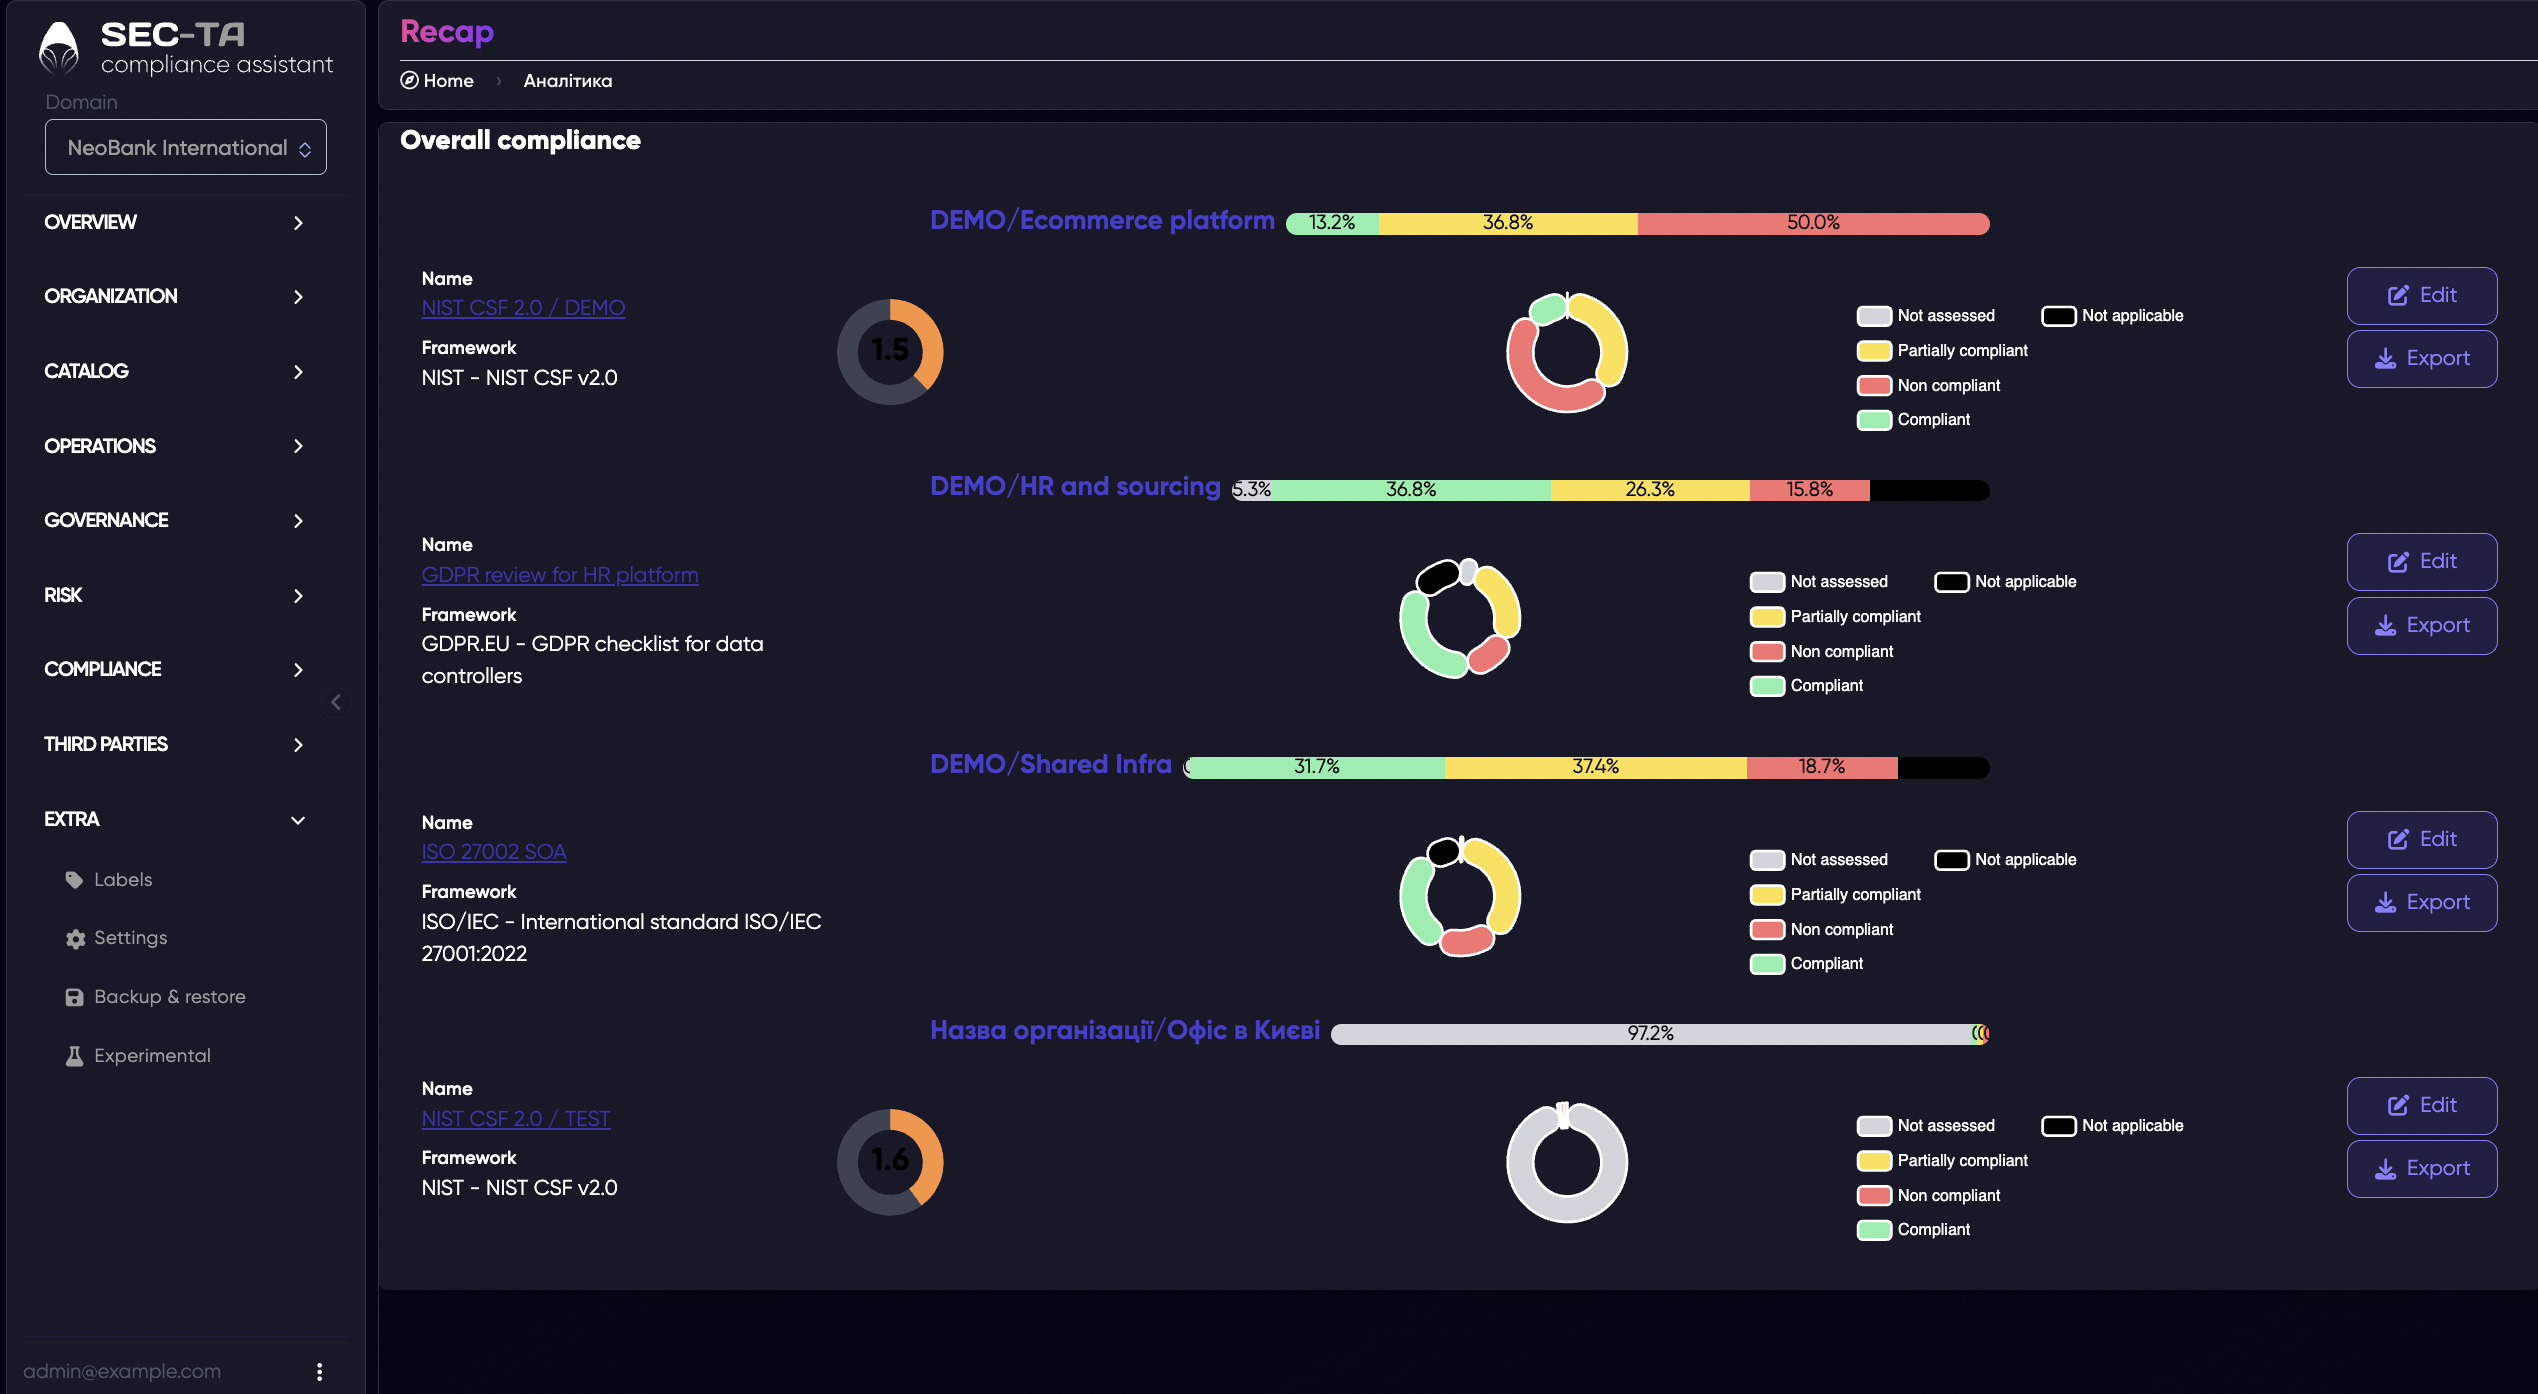
When you click the Edit button, a form appears that allows you to modify audit details for the selected framework or domain.
Field descriptions:
Name: The title of the audit or assessment.
Description: Optional field to add details about the audit’s purpose, scope, or notes.
Target framework: The cybersecurity or compliance framework used for the audit (e.g., NIST CSF 2.0, ISO 27001, GDPR).
Authors: The person or team responsible for creating or managing the audit.
ETA: The estimated date for audit completion or review.
Use documentation score: Enables an additional scoring option for evaluating the quality of related documentation.
Assets: Select the assets (systems, processes, or data) that are covered by this audit.
Reference ID: A unique identifier for tracking or linking the audit to other records.
Version: Indicates the version of the audit or framework being used.
Status: Current progress of the audit (e.g., In progress, Planned, Completed).
Reviewers – People responsible for reviewing or approving the audit results.
Due date: The deadline by which the audit or reassessment must be completed.
Observation: A notes field for additional comments, findings, or contextual information related to the audit.
When you click the Export button, a summary report of the selected audit is automatically generated and saved as an index.html file. This report provides a clear and structured overview of the audit results, including:
- The target framework used (for example, NIST CSF 2.0, ISO 27001, GDPR);
- A breakdown of cybersecurity measures across framework functions (Govern, Identify, Protect, Detect, Respond, Recover);
- The number and percentage of implemented, in-progress, and planned controls;
- The overall compliance score and detailed notes or metrics for each function.
¶ Composer
Composer is a tool that allows you to combine data from multiple components (known as perimeters) to form an overall picture of your risks.
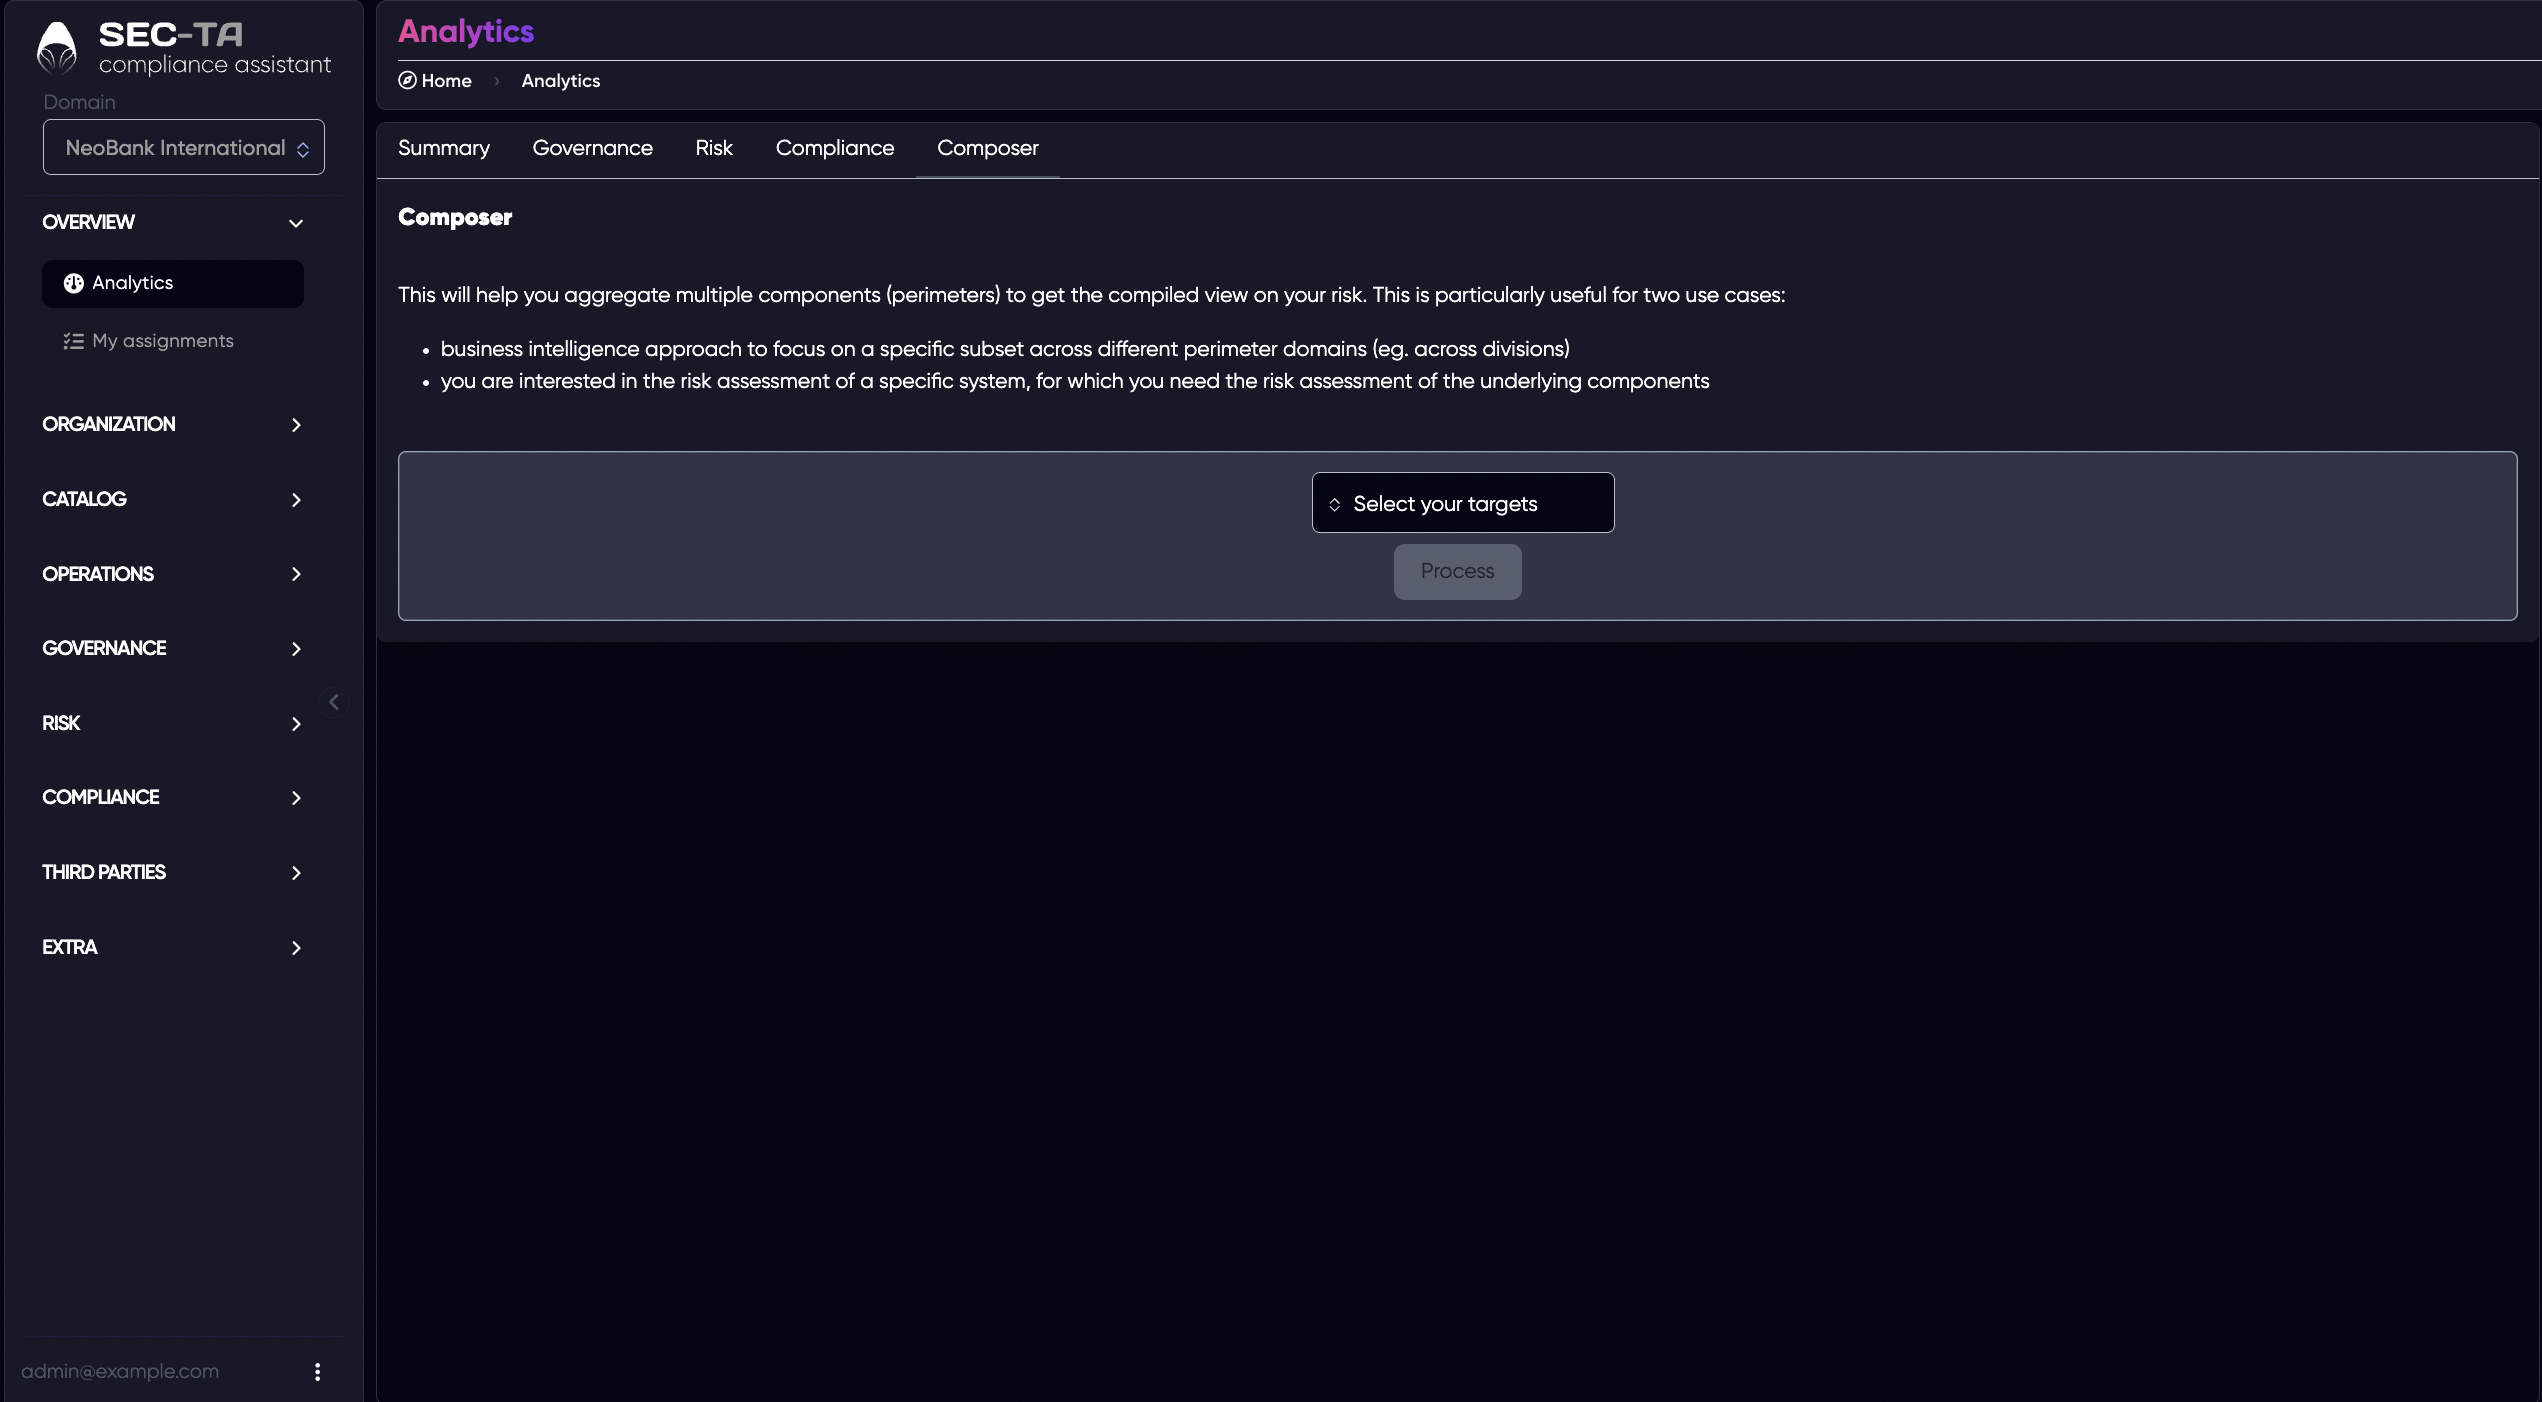
Select your targets - opens a selection menu where you choose which components, systems, or organizational units to include in your analysis.
Process - performs analysis after selecting targets — this button becomes active after selecting elements.
After that, a report will appear.